Real Archshaper Site Analysis examples
Wind context matters for entrances, public spaces, waterfronts and exposed courtyards. Regional wind information can help an architecture team discuss orientation and potential exposure early in design. Archshaper presents these conditions as readable diagrams that sit alongside building, circulation and landscape maps.
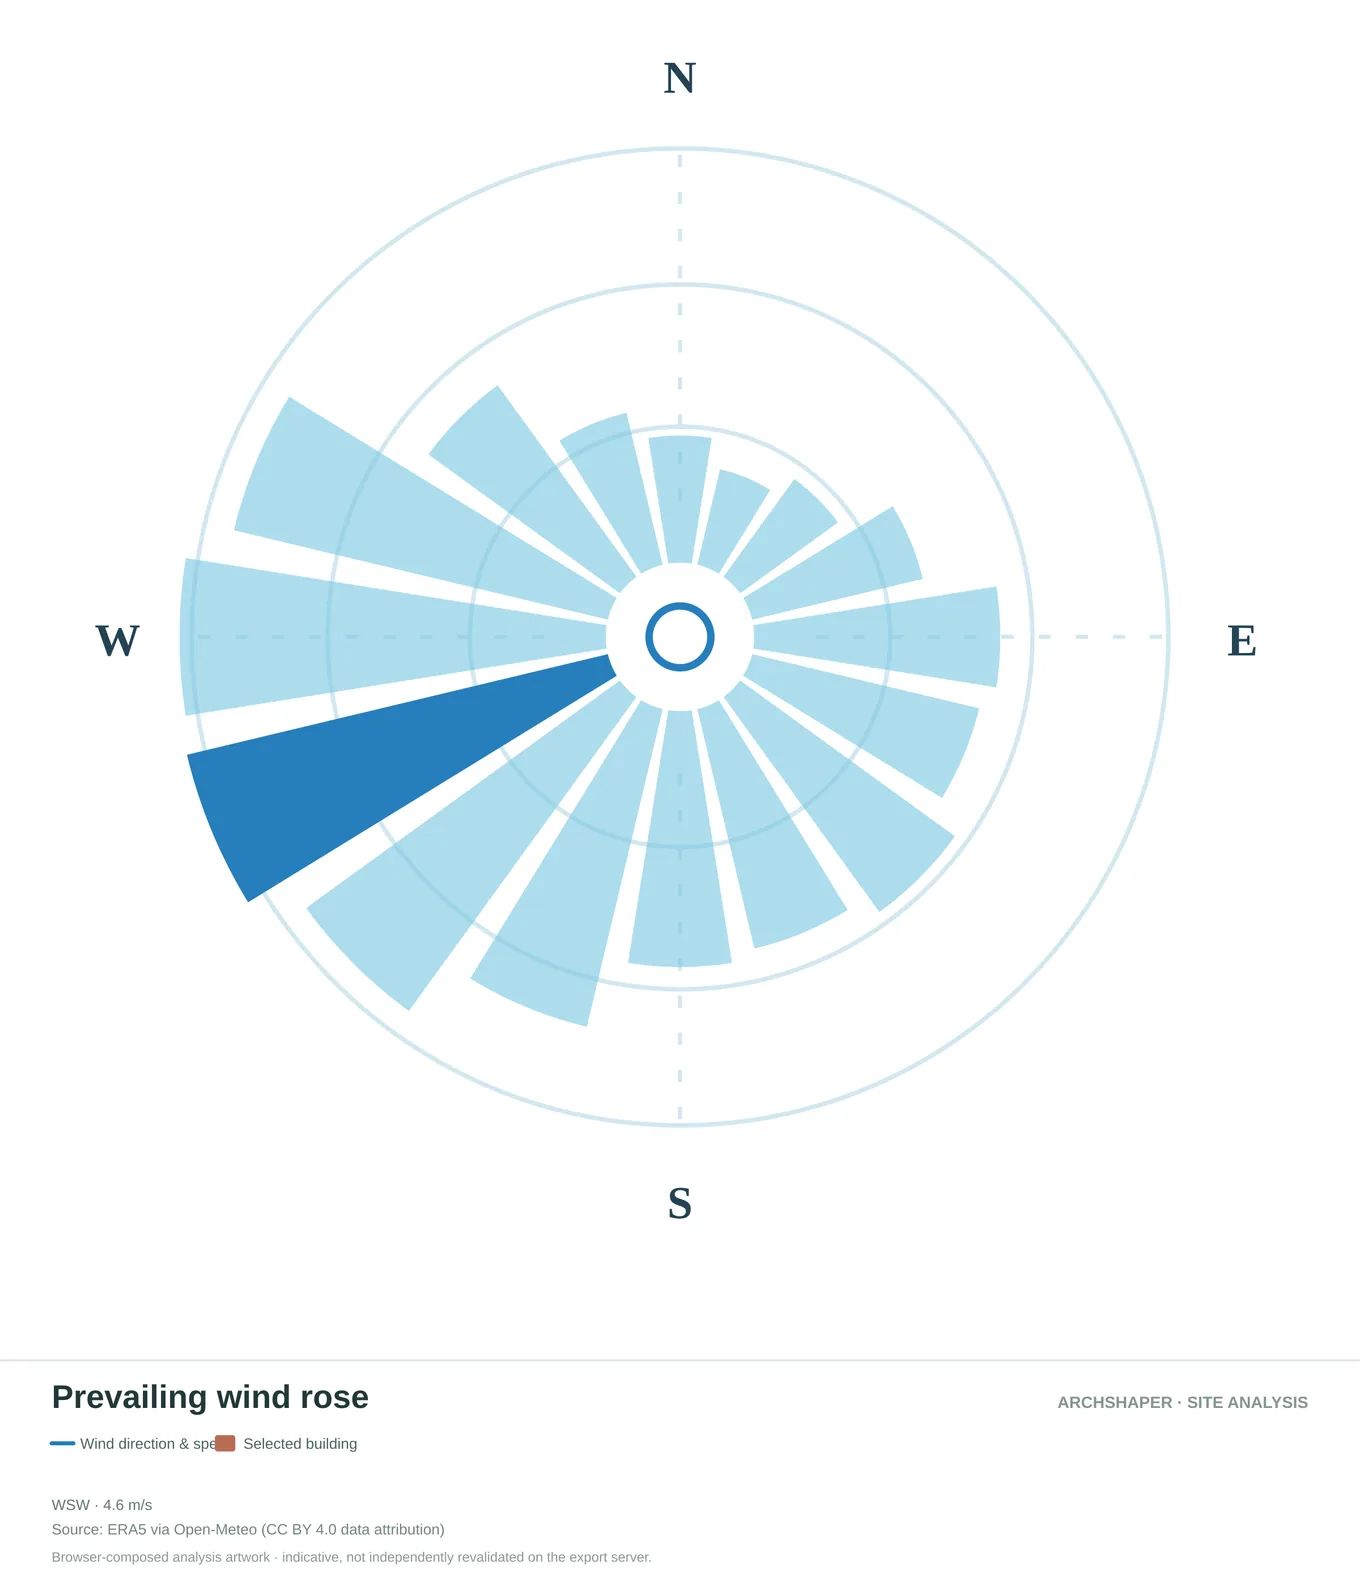
Directional distribution of prevailing regional wind conditions.
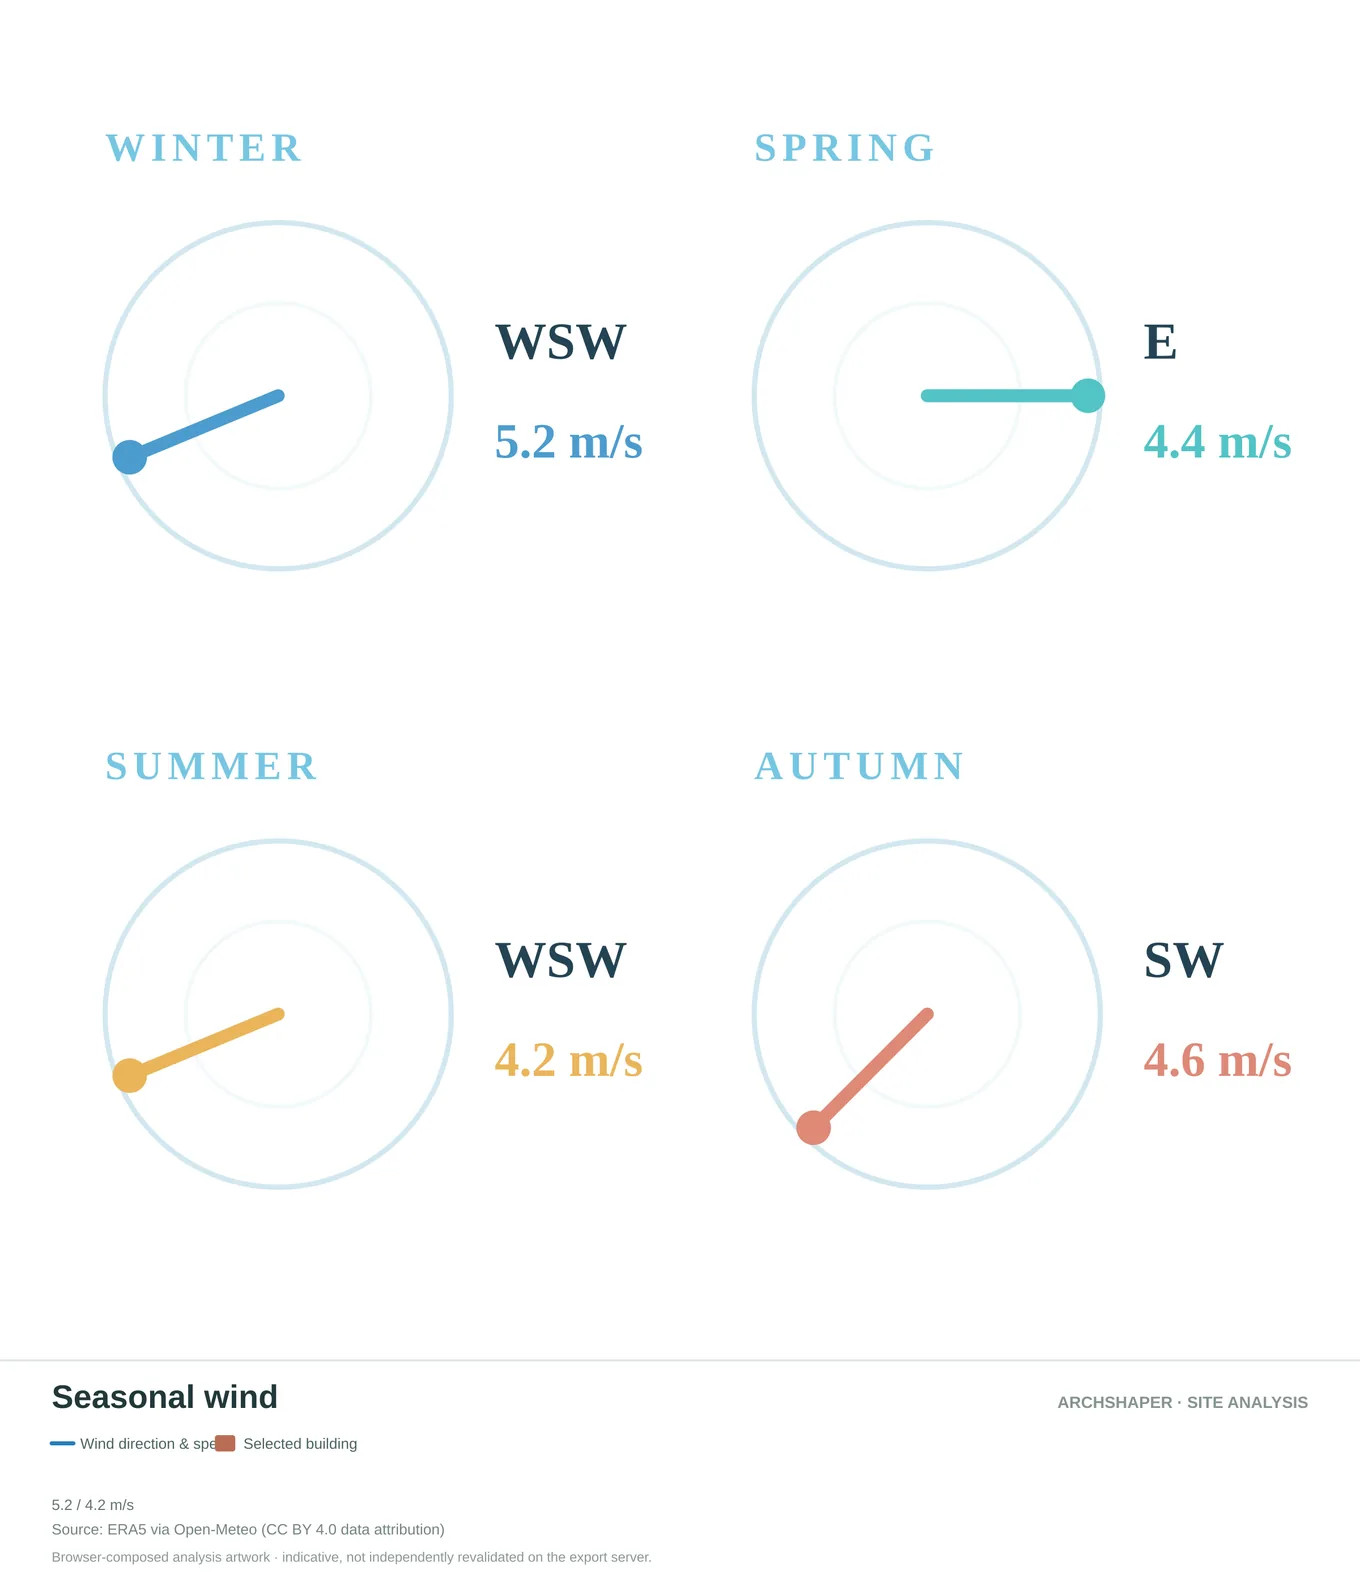
Compare regional wind direction and speed between seasons.
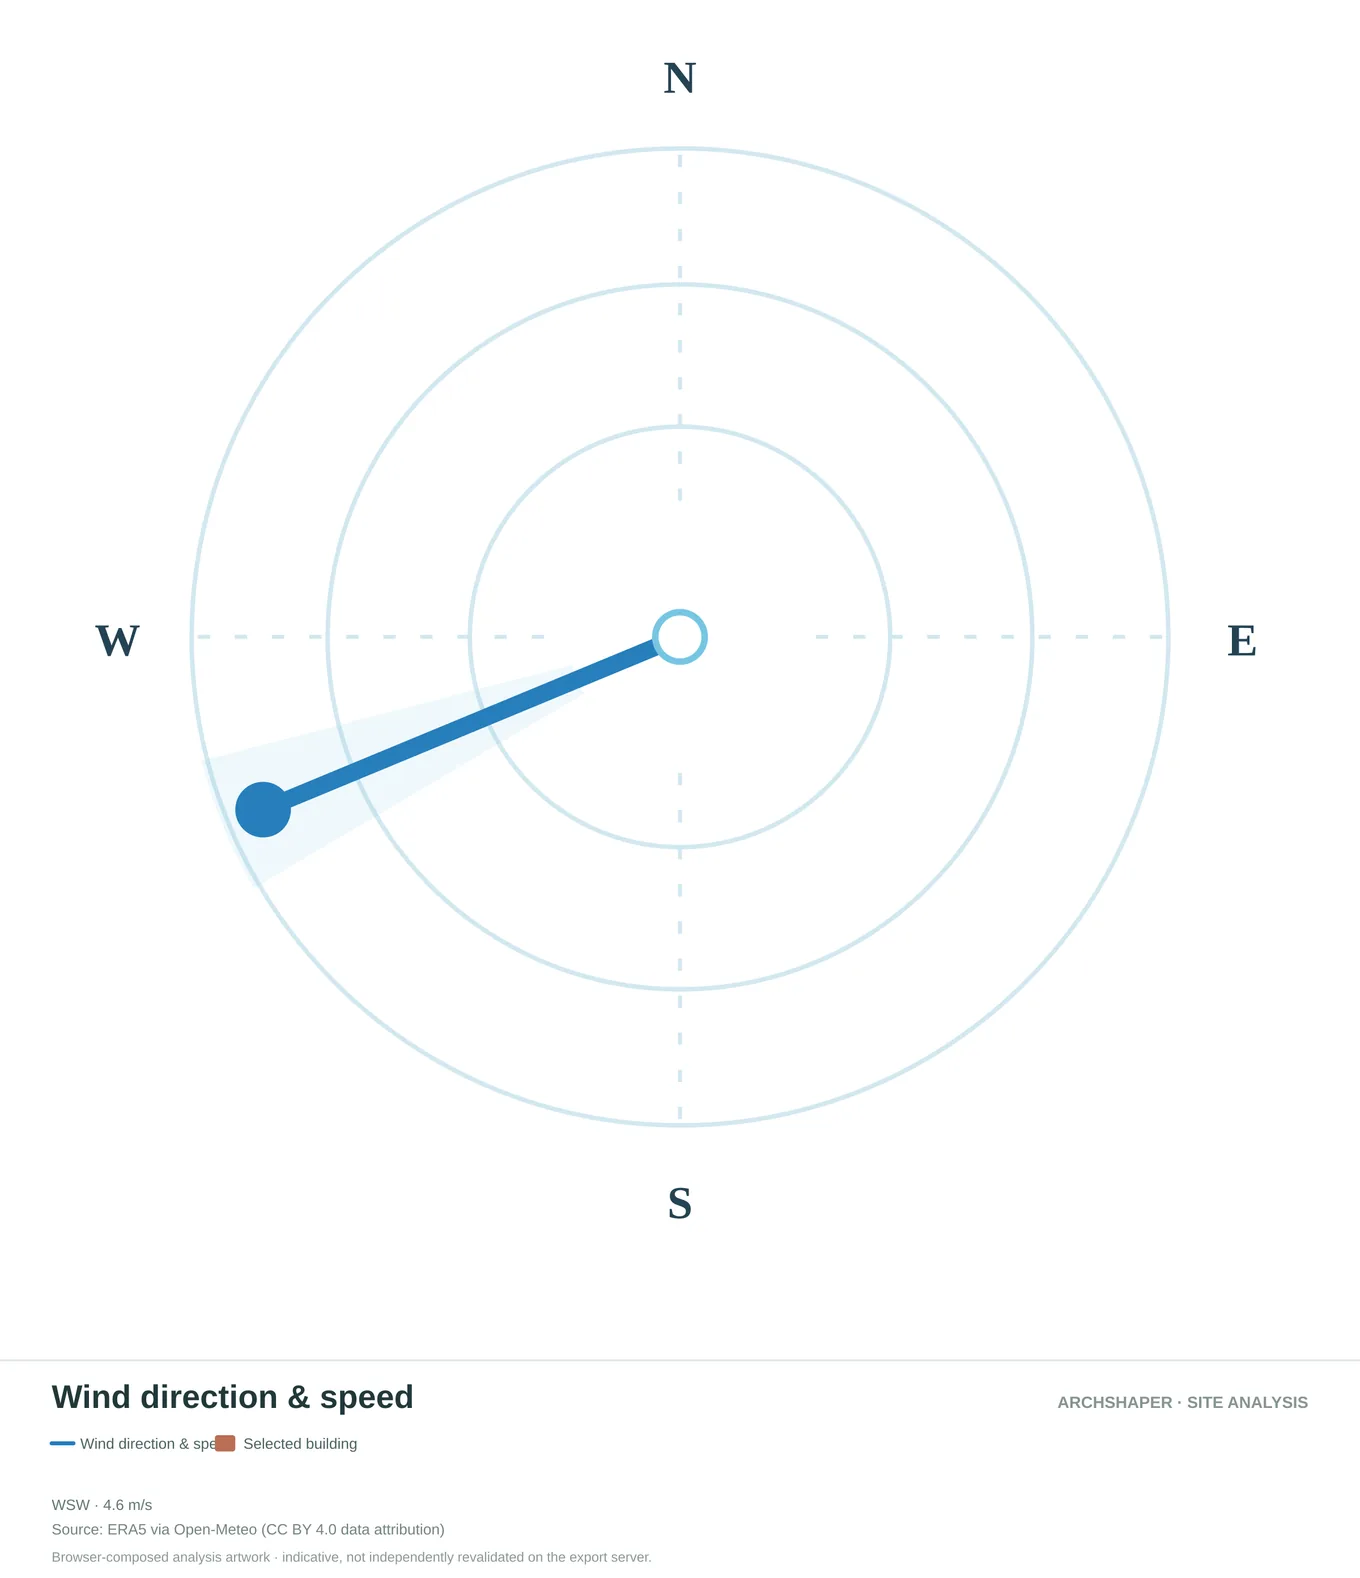
Directional regional wind information in a simplified polar view.
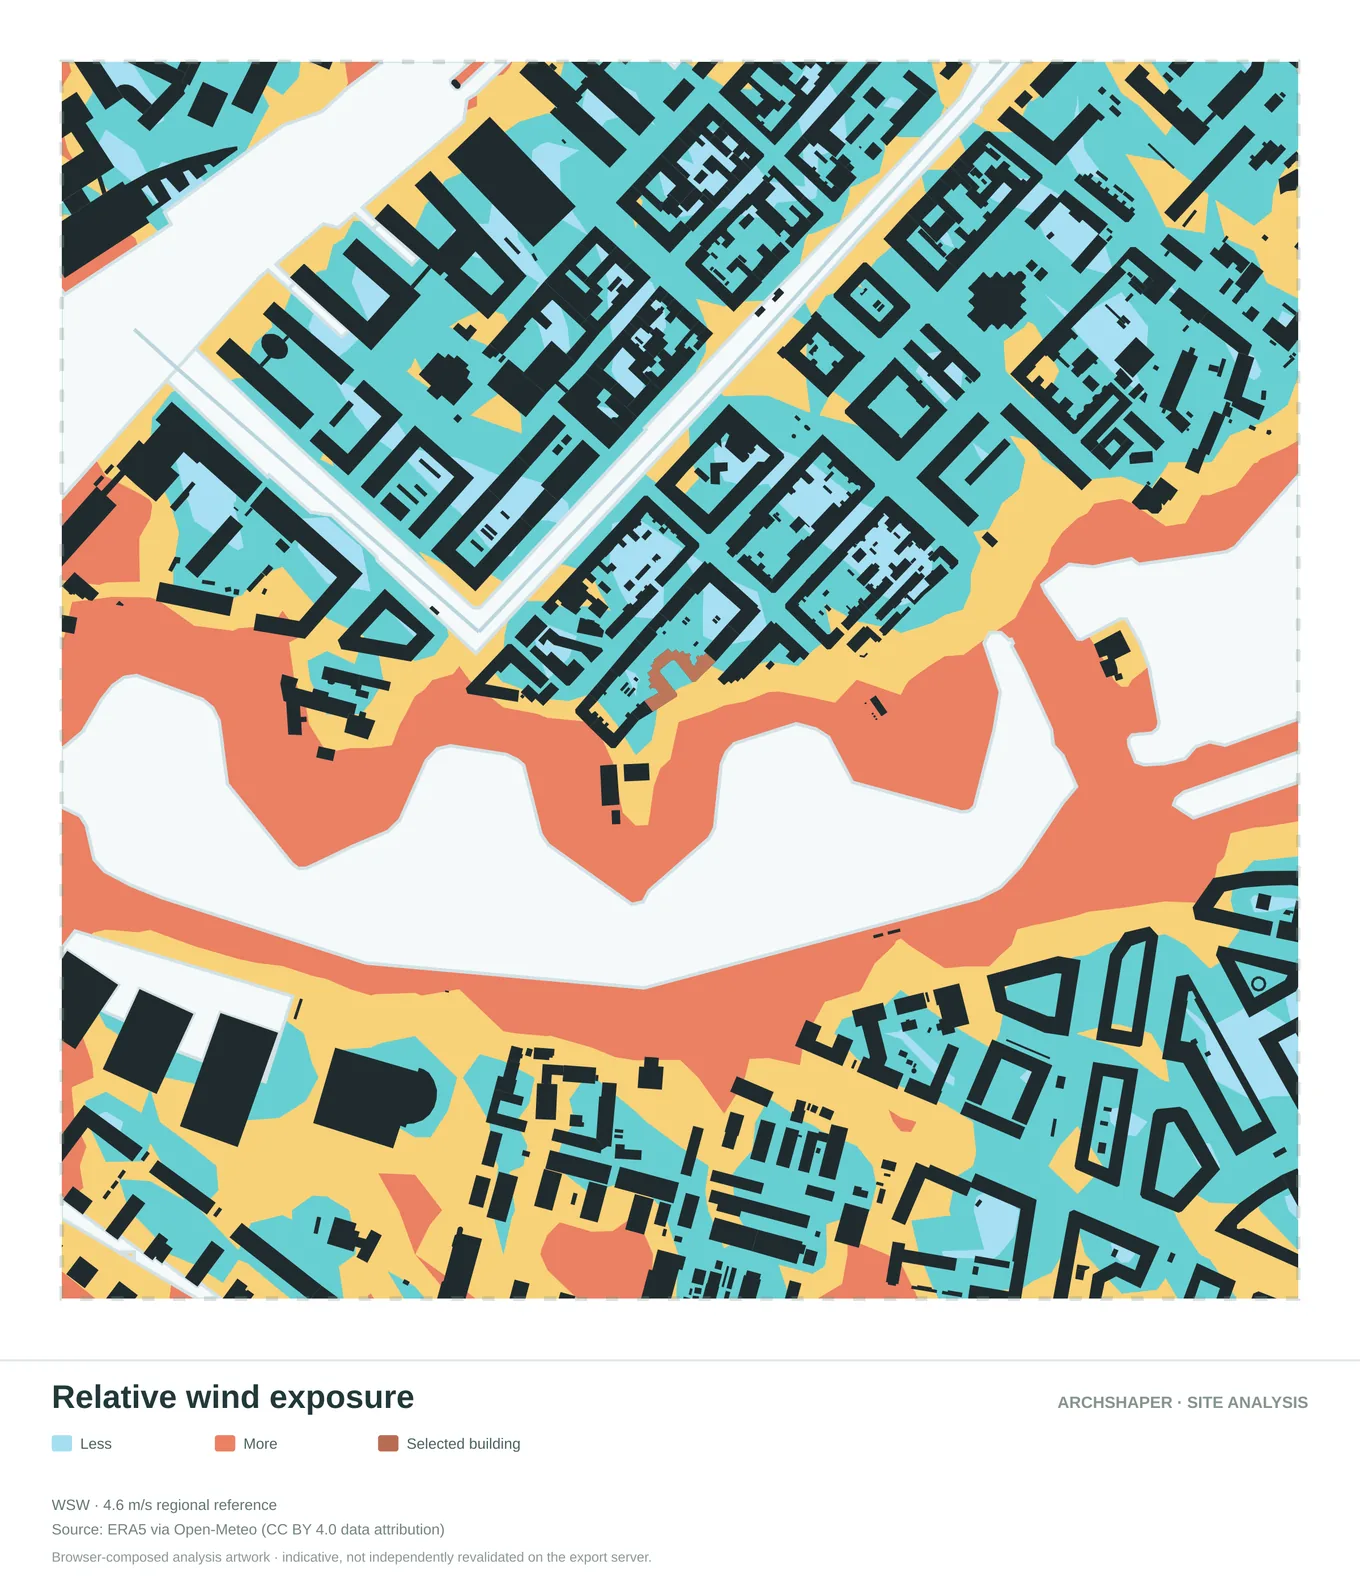
Compare mapped zones of lower and higher relative exposure.
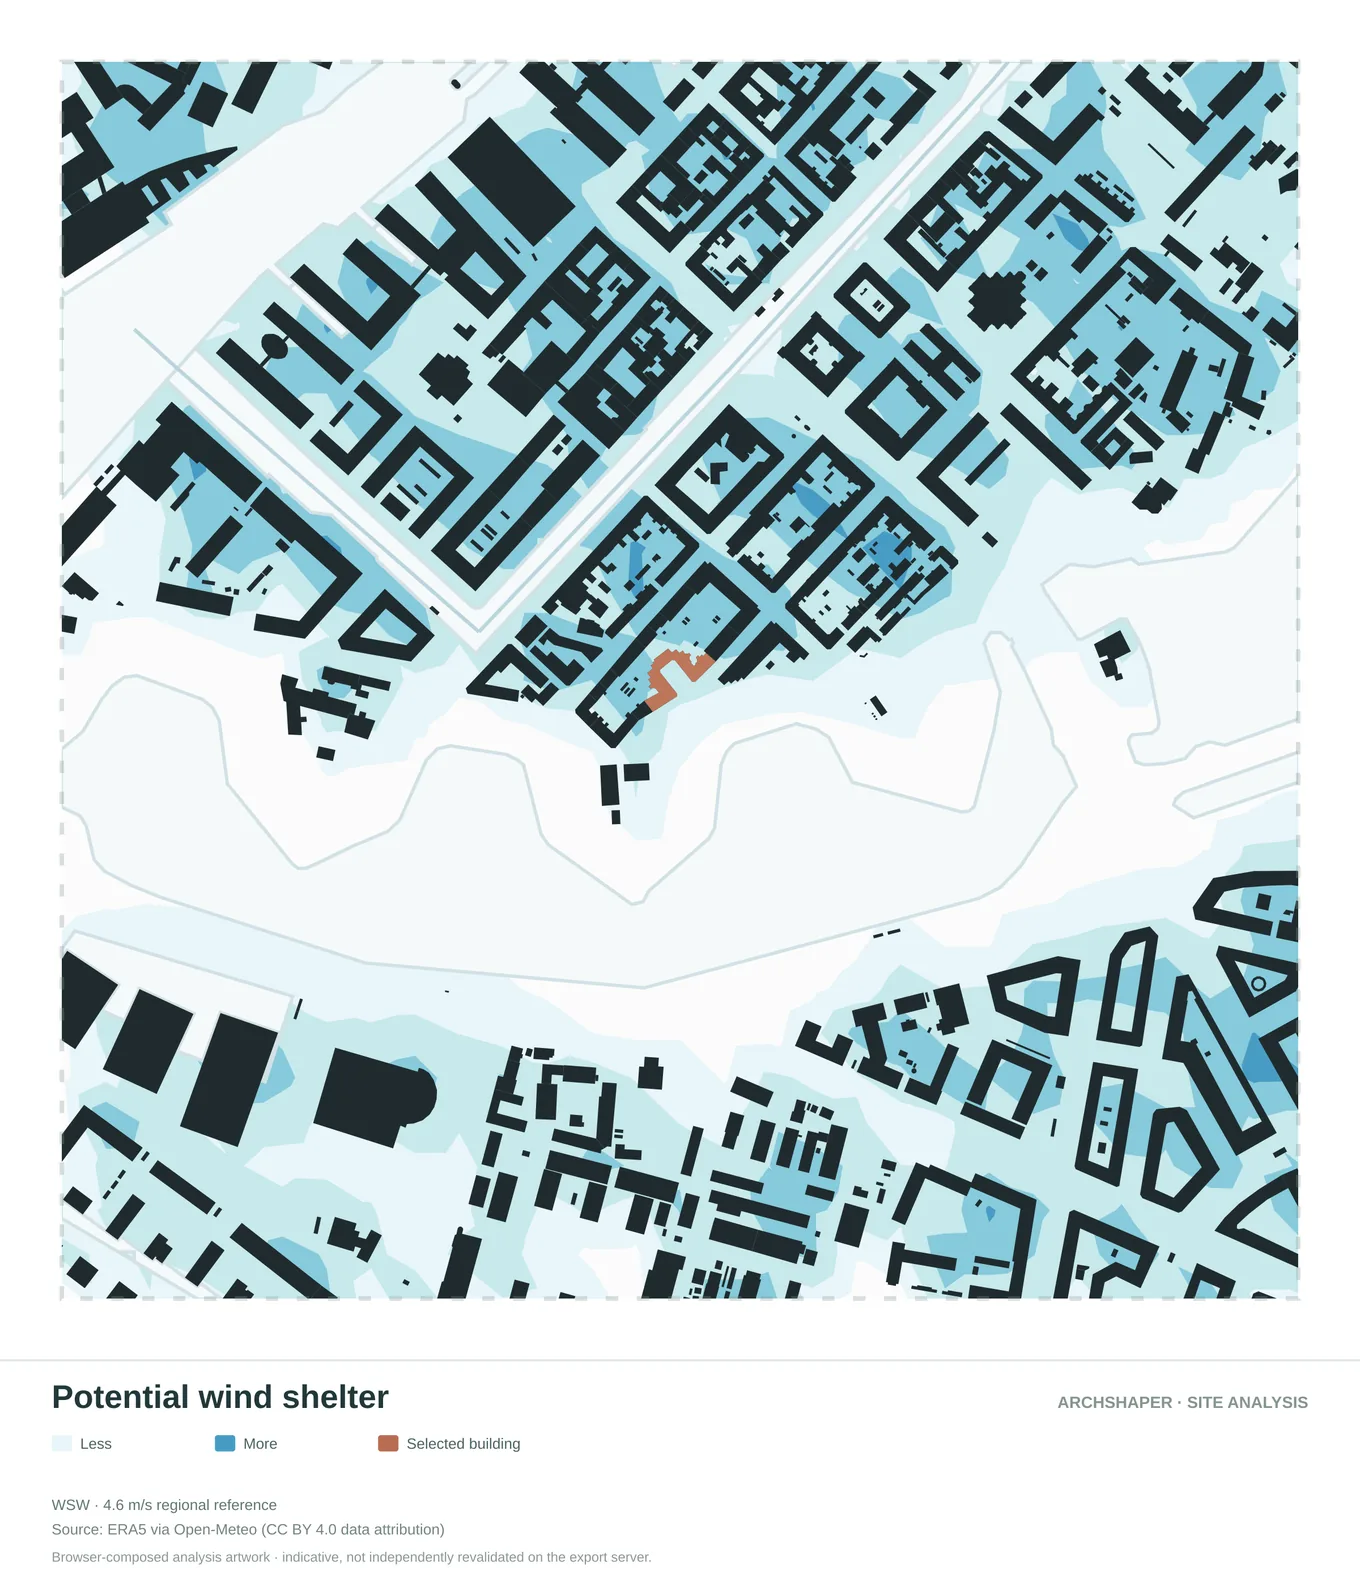
A diagram highlighting potential sheltered areas around the urban fabric.
How to read these diagrams
Prevailing wind context
Explore regional wind direction and the reference speed associated with the data source.
Relative exposure
Interpret a legend showing higher and lower relative exposure around the study area.
Project boundary
Keep the selected site visible so the wind context relates to a design decision.
Consistent analysis set
Compare wind context with transport, built-form and landscape diagrams of the same location.
What does a wind analysis diagram show?
A wind diagram can communicate prevailing regional directions and the spatial pattern of a simplified relative exposure layer. Its legend should state whether colours depict a relative indicator, a measured quantity or a prediction.
Use it to identify design questions, such as which open edges may merit further investigation. Do not infer an exact pedestrian-level wind speed from a diagram that does not model building-scale flow.
Regional ERA5 references versus CFD simulation
Regional weather datasets such as ERA5, available through services including Open-Meteo, describe atmospheric conditions at a much broader scale than individual building corners. They cannot replace computational fluid dynamics for turbulence, channeling and pedestrian comfort.
A relative wind exposure map is a helpful concept-stage visual. It is not a validated microclimate assessment, wind-tunnel result or building-specific CFD calculation.
Using wind context on an architecture presentation board
Pair the wind diagram with a built-form or movement map using the same orientation and study extent. Identify the conditions that matter to entrances, streets, courtyards and the public realm.
Always retain the reference direction, data attribution and explanatory legend. For tall buildings, pedestrian wind comfort or safety decisions, obtain a dedicated specialist study.
Frequently asked questions
Can I show wind context without CFD?
Yes, for regional reference conditions and relative-exposure diagrams. Local flow prediction requires specialised simulation.
Does Archshaper simulate airflow around buildings?
Its regional wind and relative exposure views should not be treated as validated CFD simulations.
What does prevailing wind mean?
It describes common regional wind directions, rather than a site-specific pedestrian-level flow measurement.
Where do the regional wind values come from?
The diagram can use regional reference data such as ERA5 via Open-Meteo. Check the specific source attribution shown with the map.
Can I export the wind diagram?
Open Site Analysis to inspect the available studies and see current file options and credit costs before export.