Real Archshaper Site Analysis examples
A site analysis diagram isolates a design question. Circulation, building use, water, landscape and environmental studies each reveal different relationships around one project site.
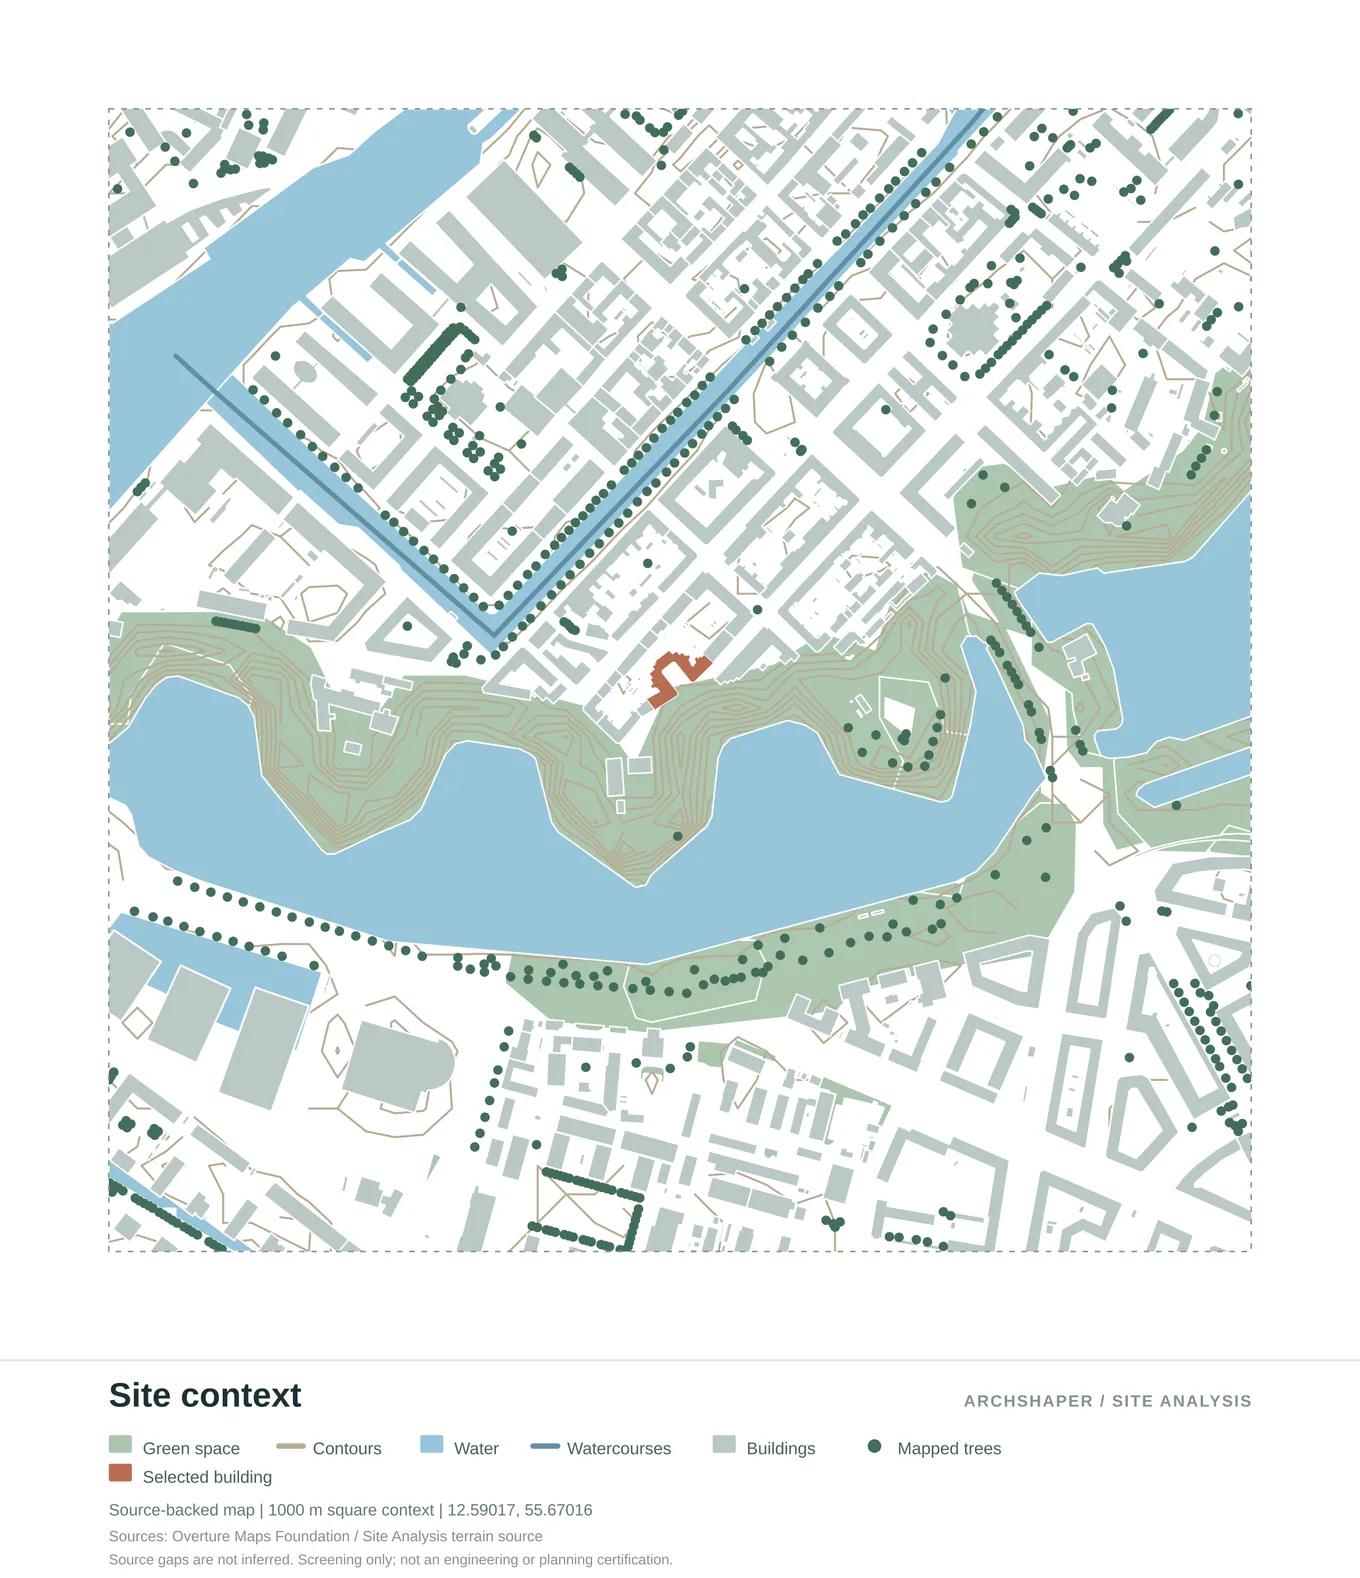
Buildings, streets, landscape, waterways and the selected project site in one map.
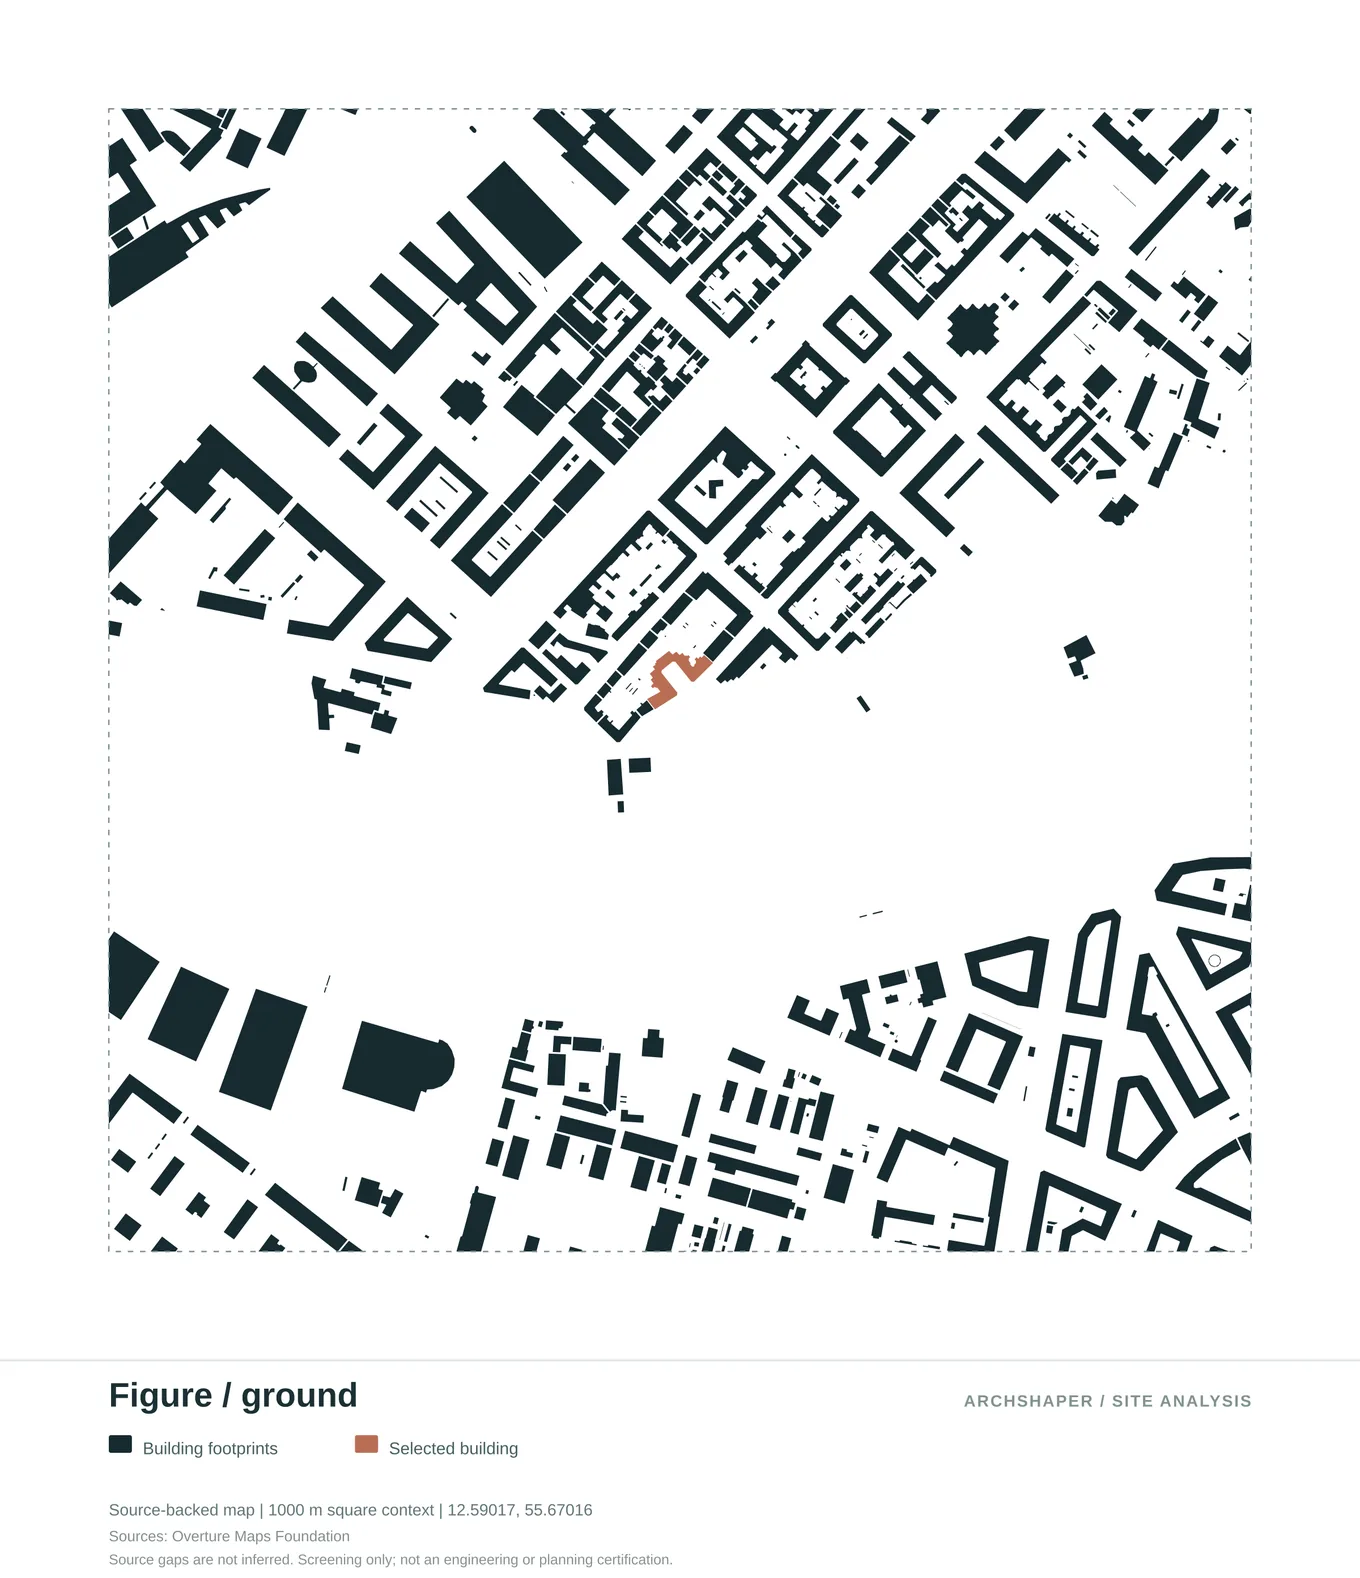
A simplified map of built mass and open space around the project site.
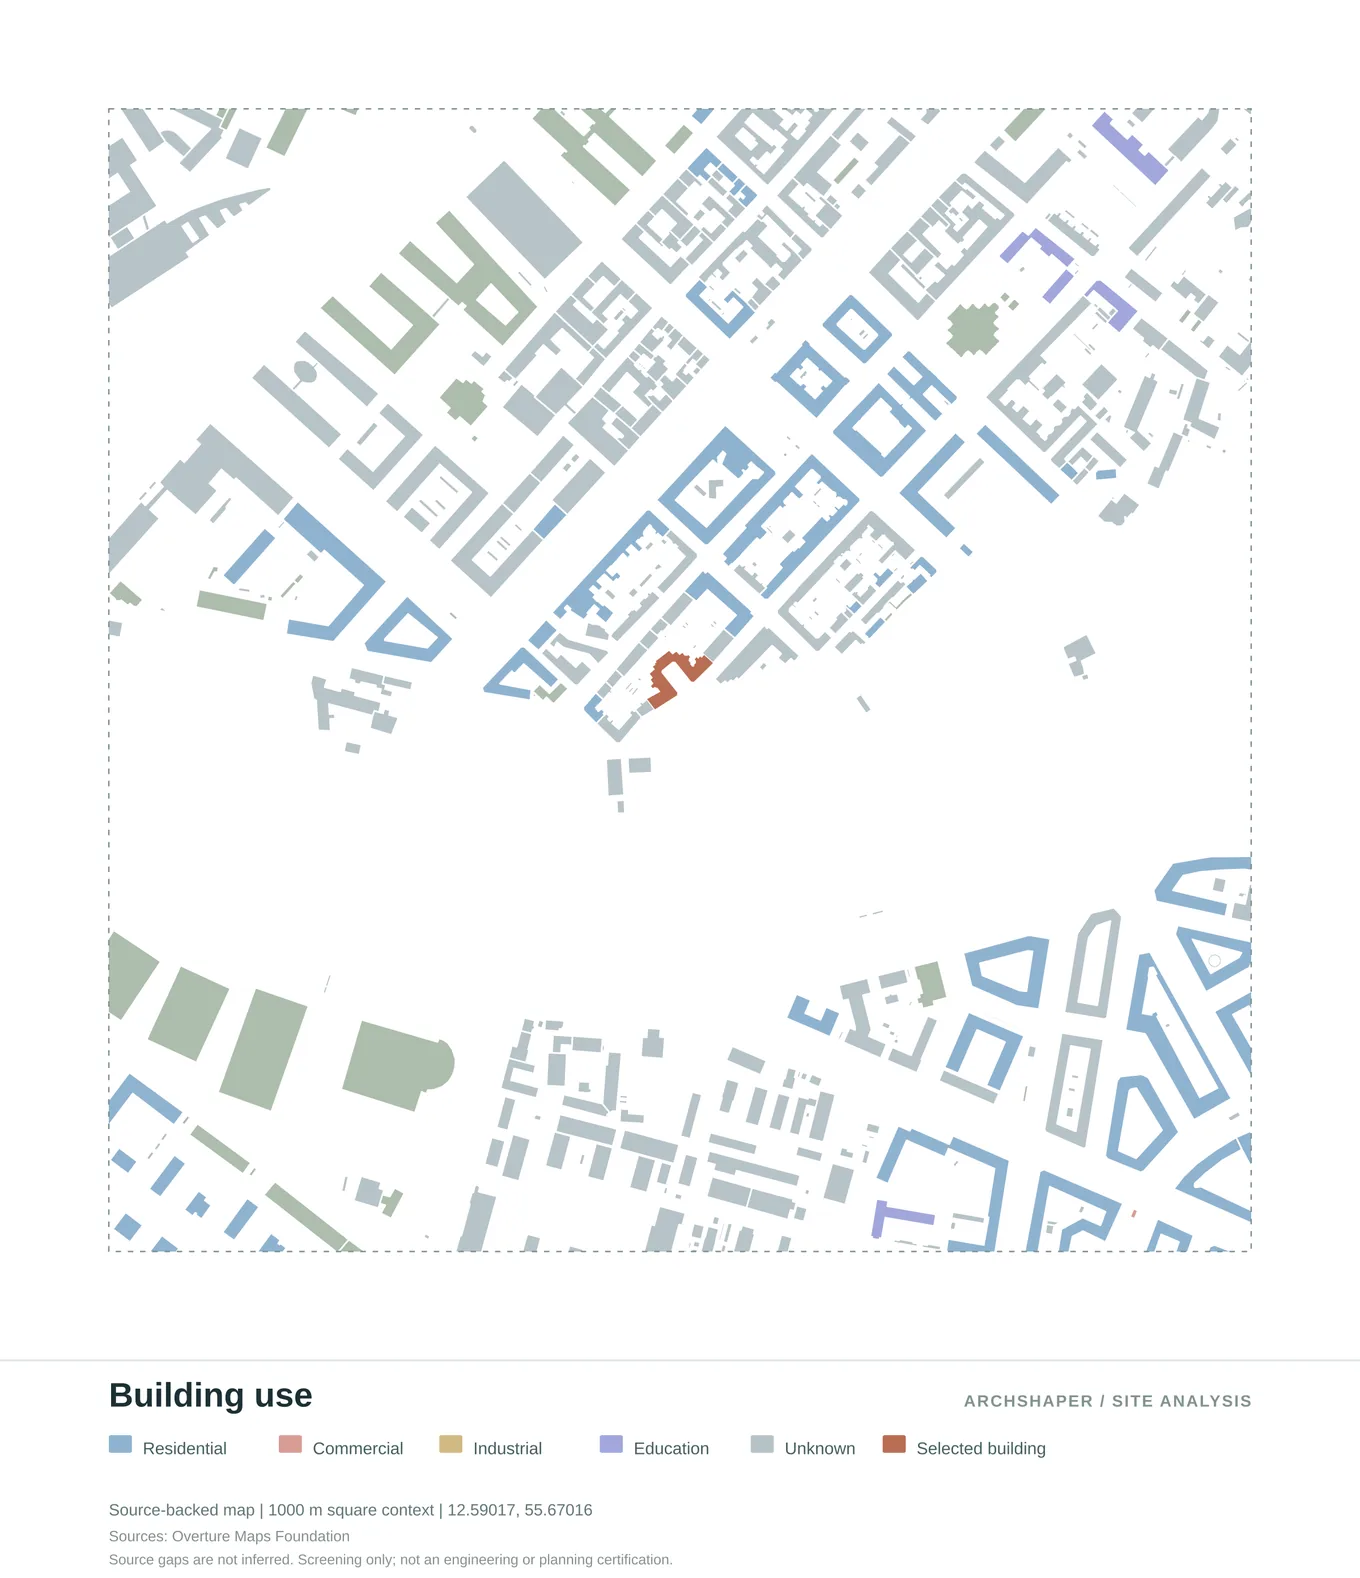
Mapped building functions with a clear colour-coded legend.
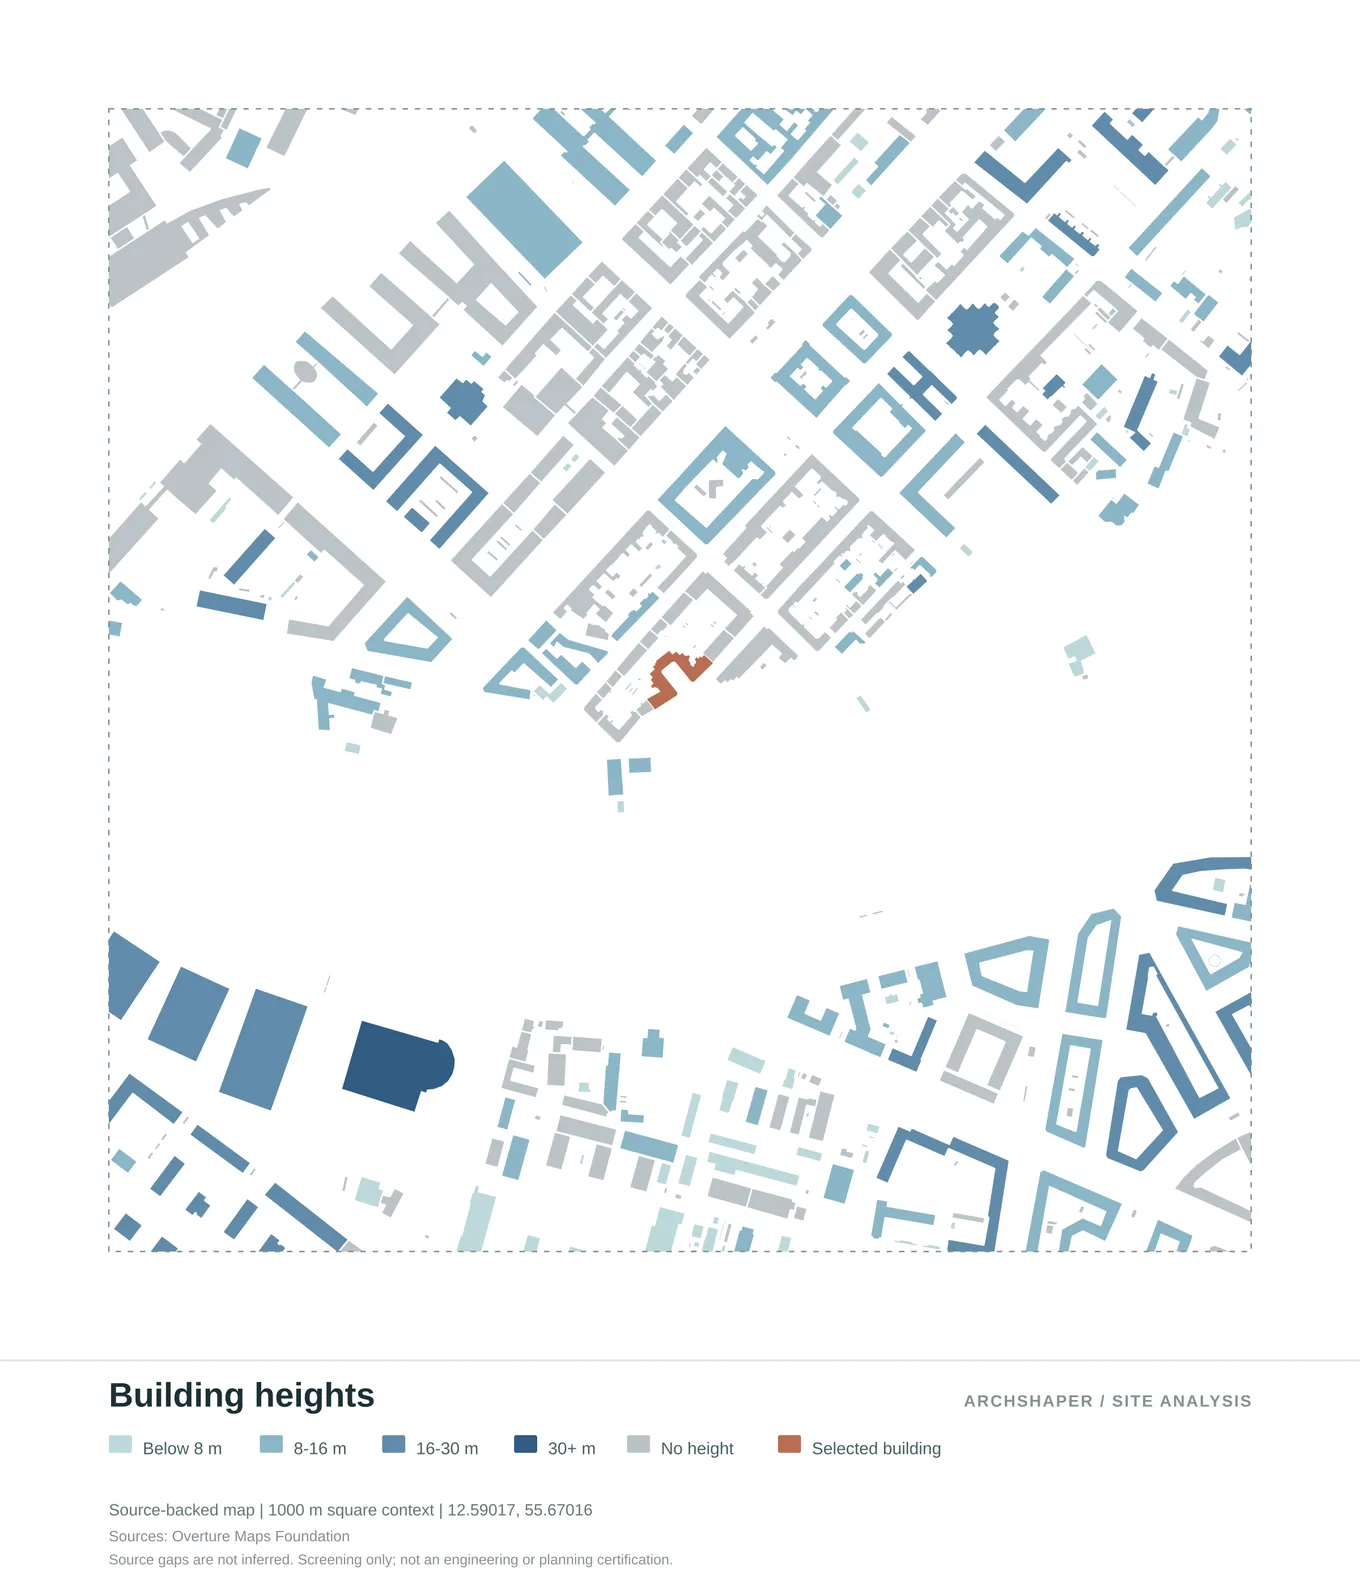
Compare mapped building-height categories across the surrounding blocks.
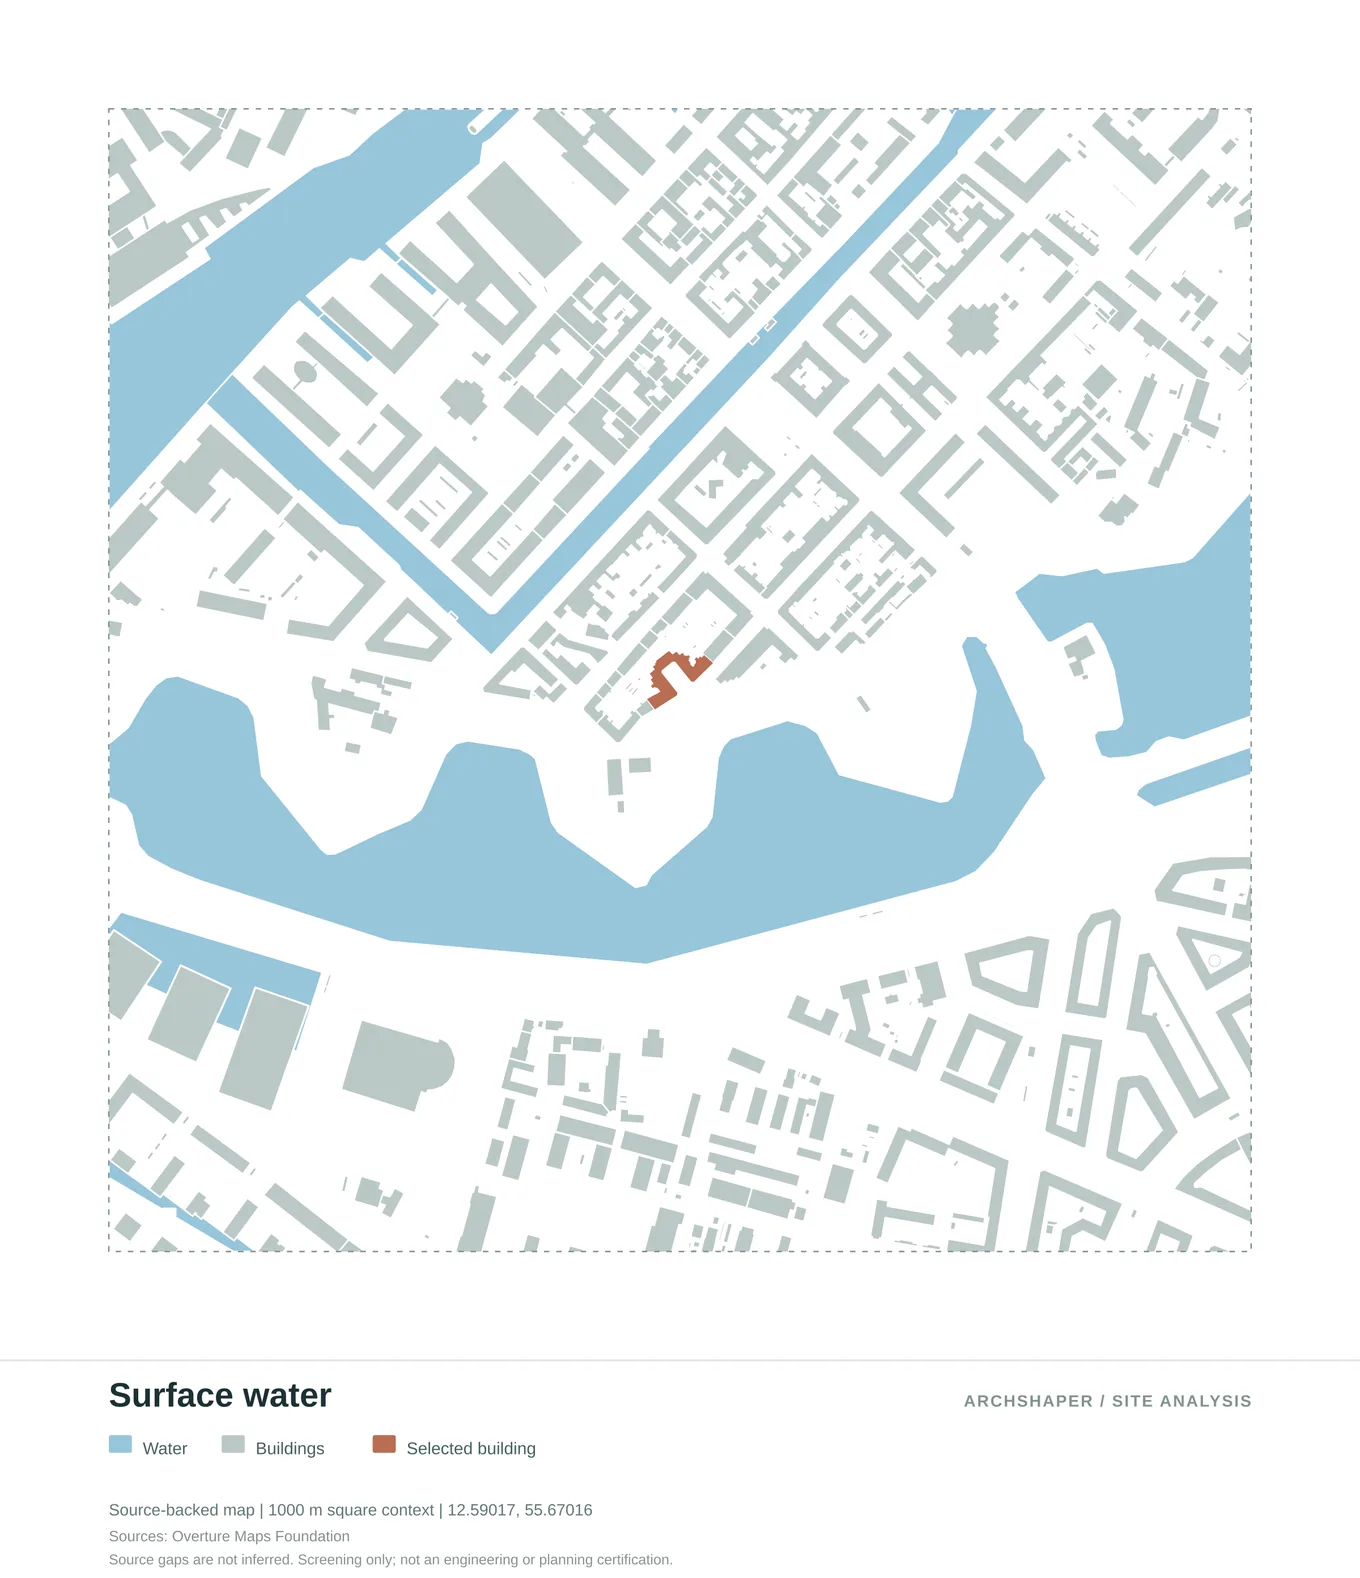
Water bodies and the site's relationship to rivers, canals and coastlines.
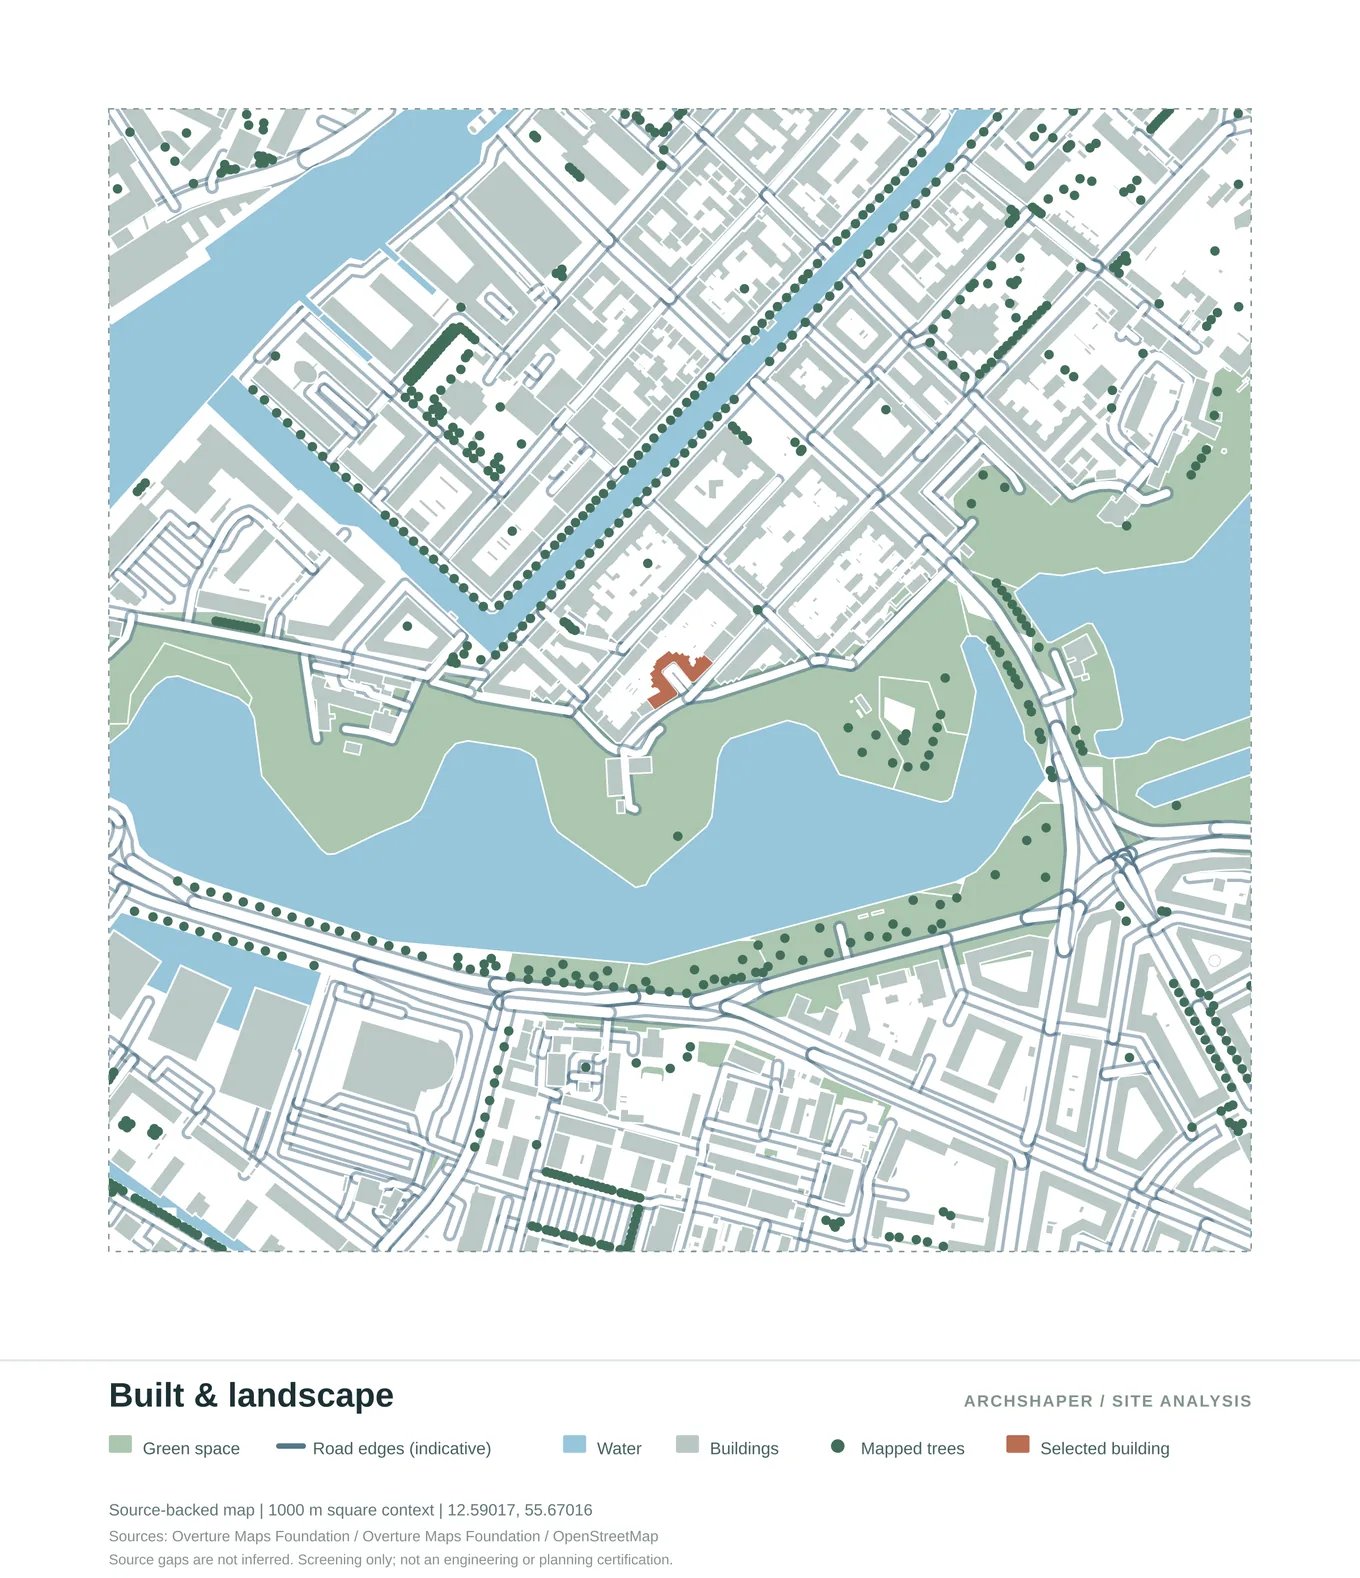
The relationship between urban fabric, vegetation and open space.
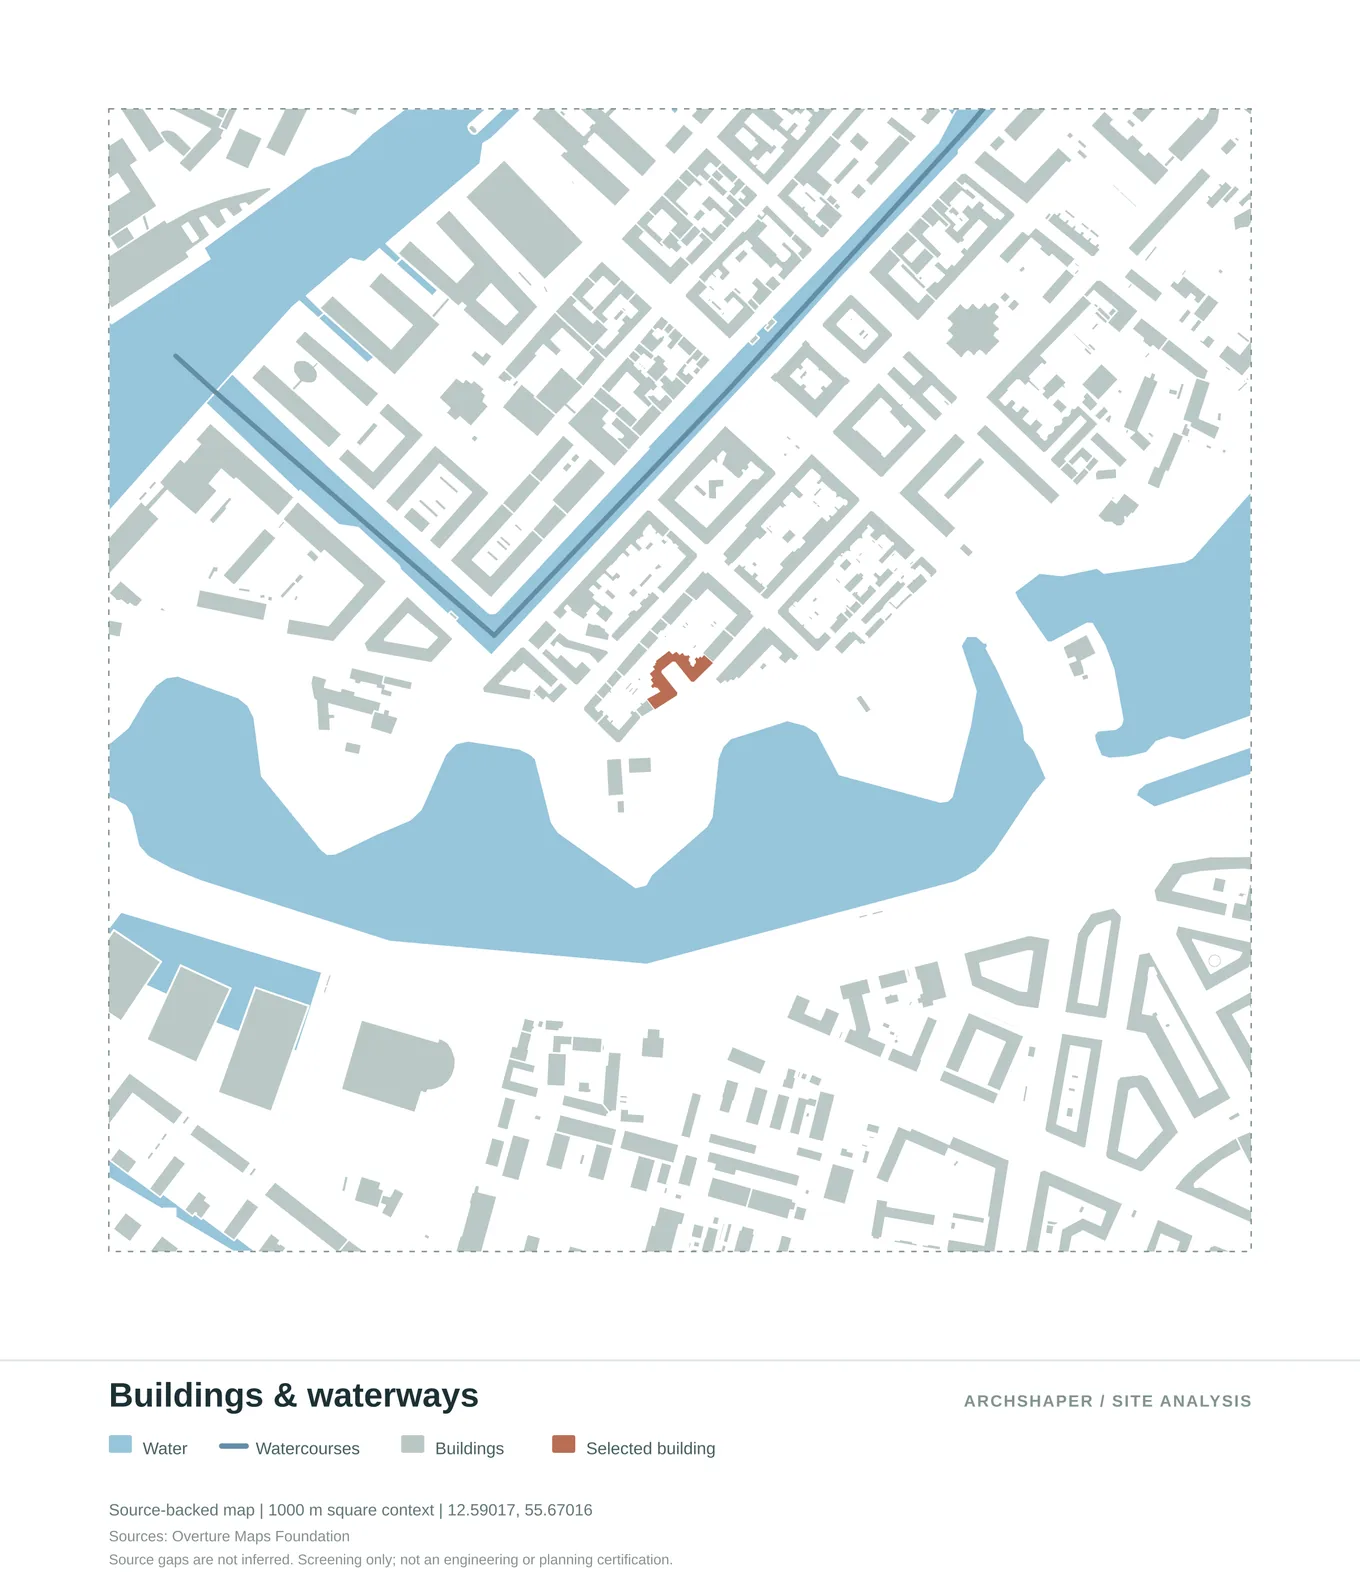
Read the built structure alongside blue infrastructure.
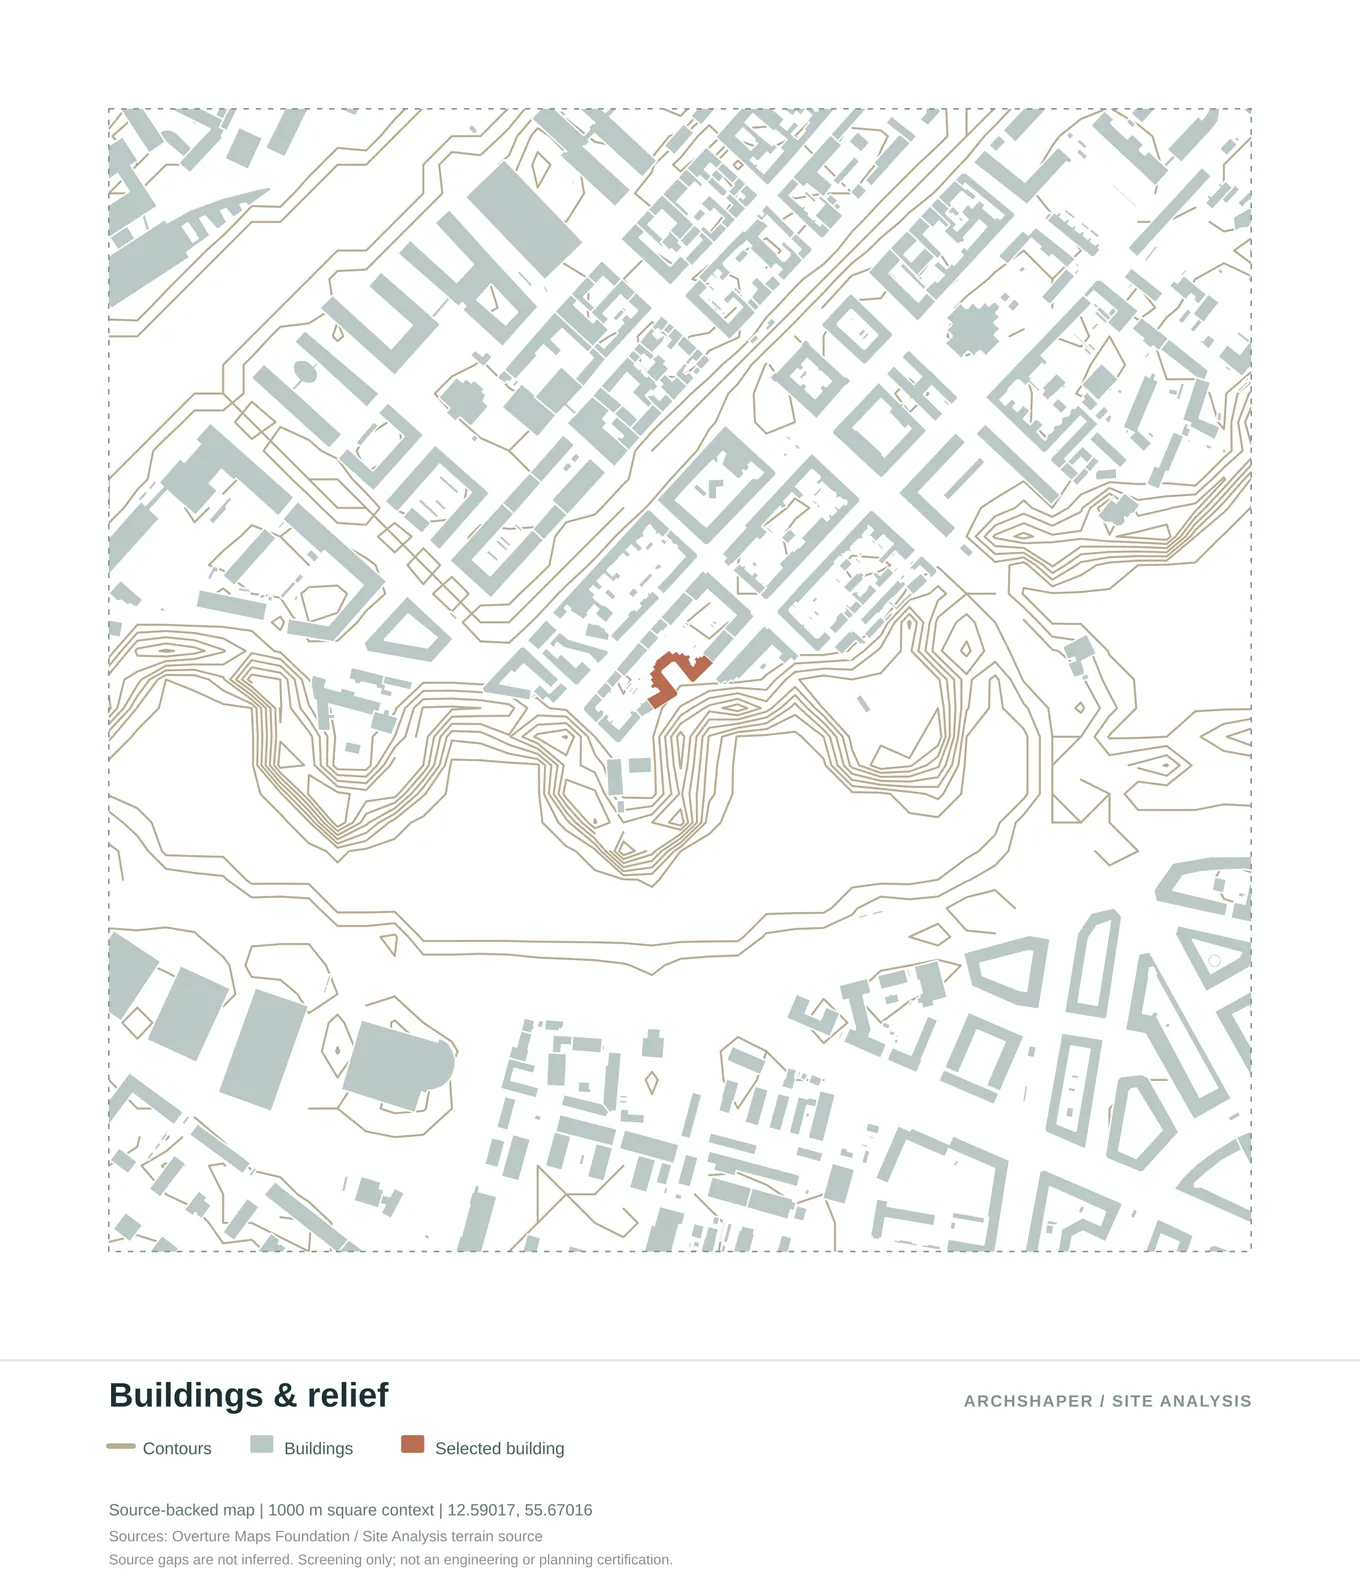
Terrain contours, building footprints and the site context.
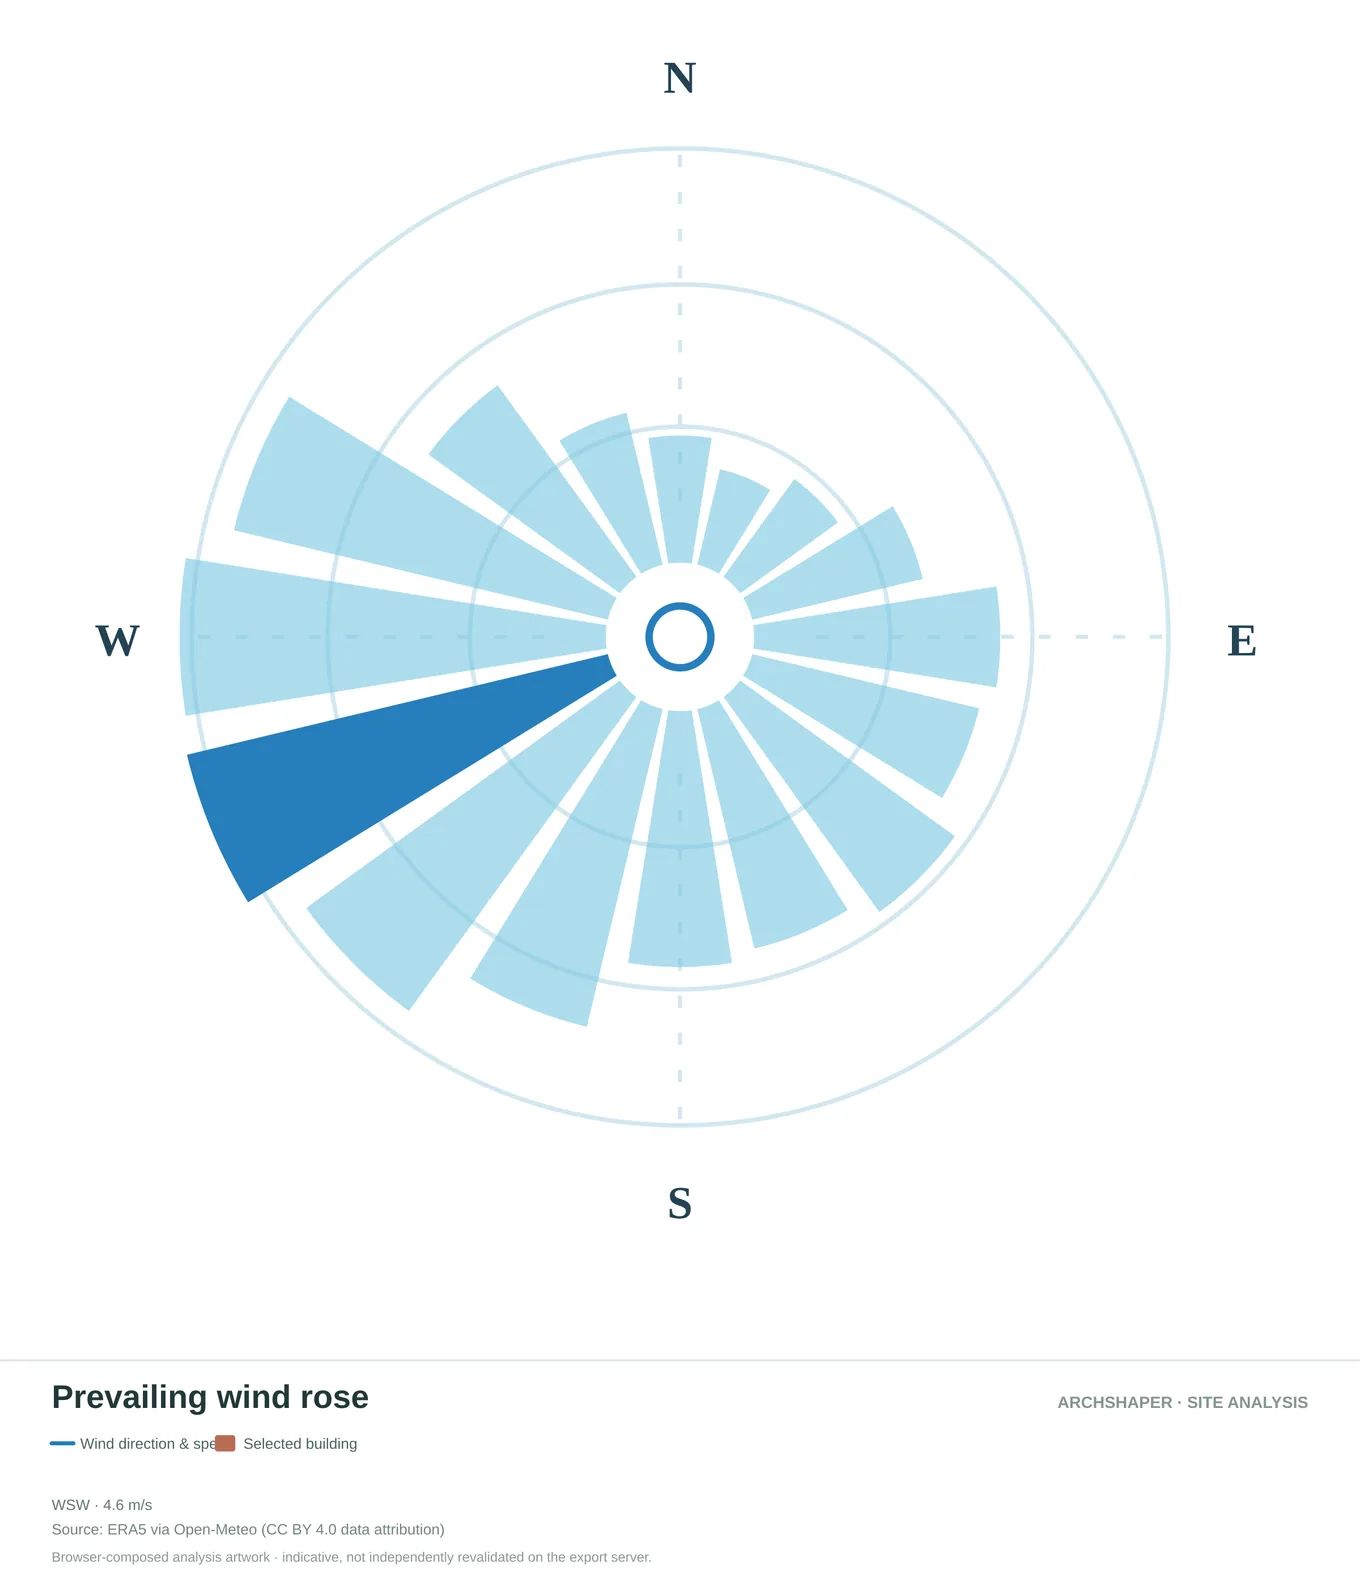
Directional distribution of prevailing regional wind conditions.
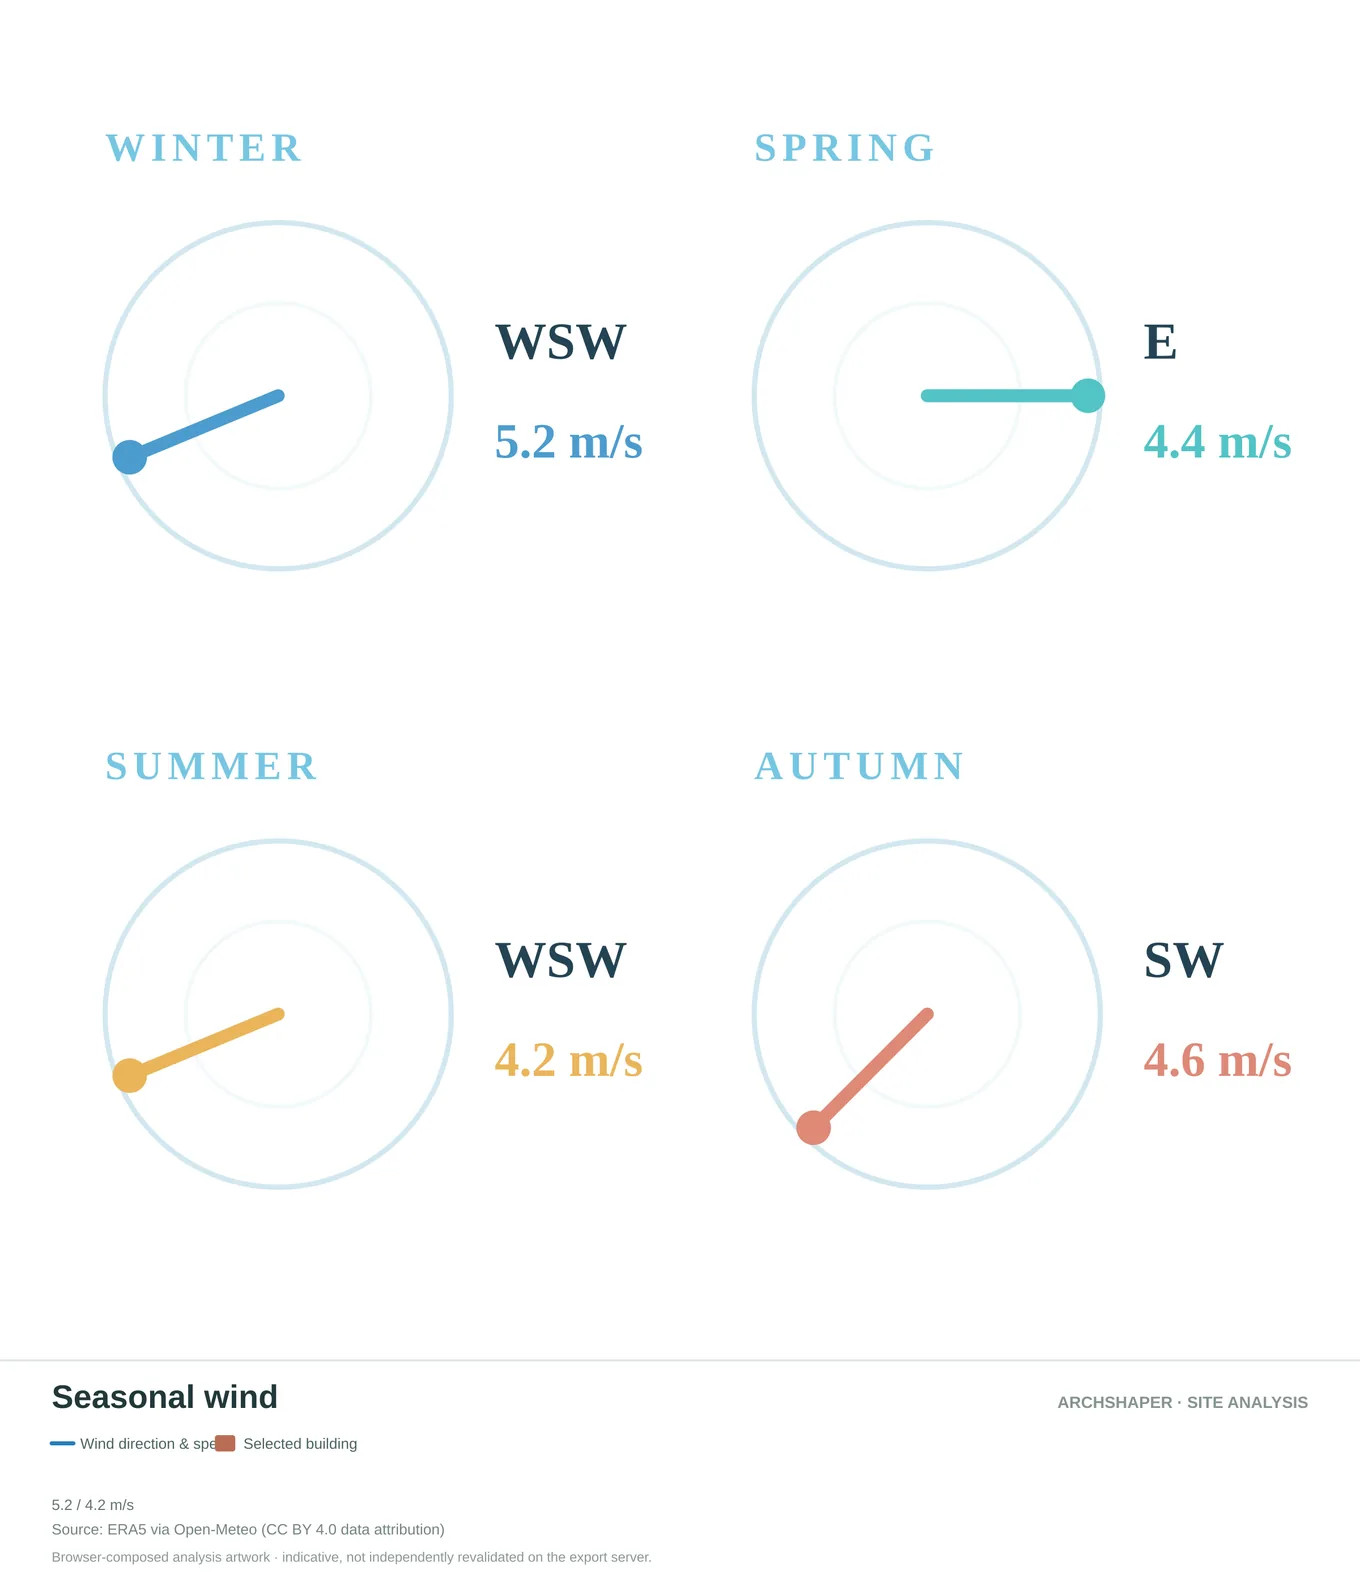
Compare regional wind direction and speed between seasons.
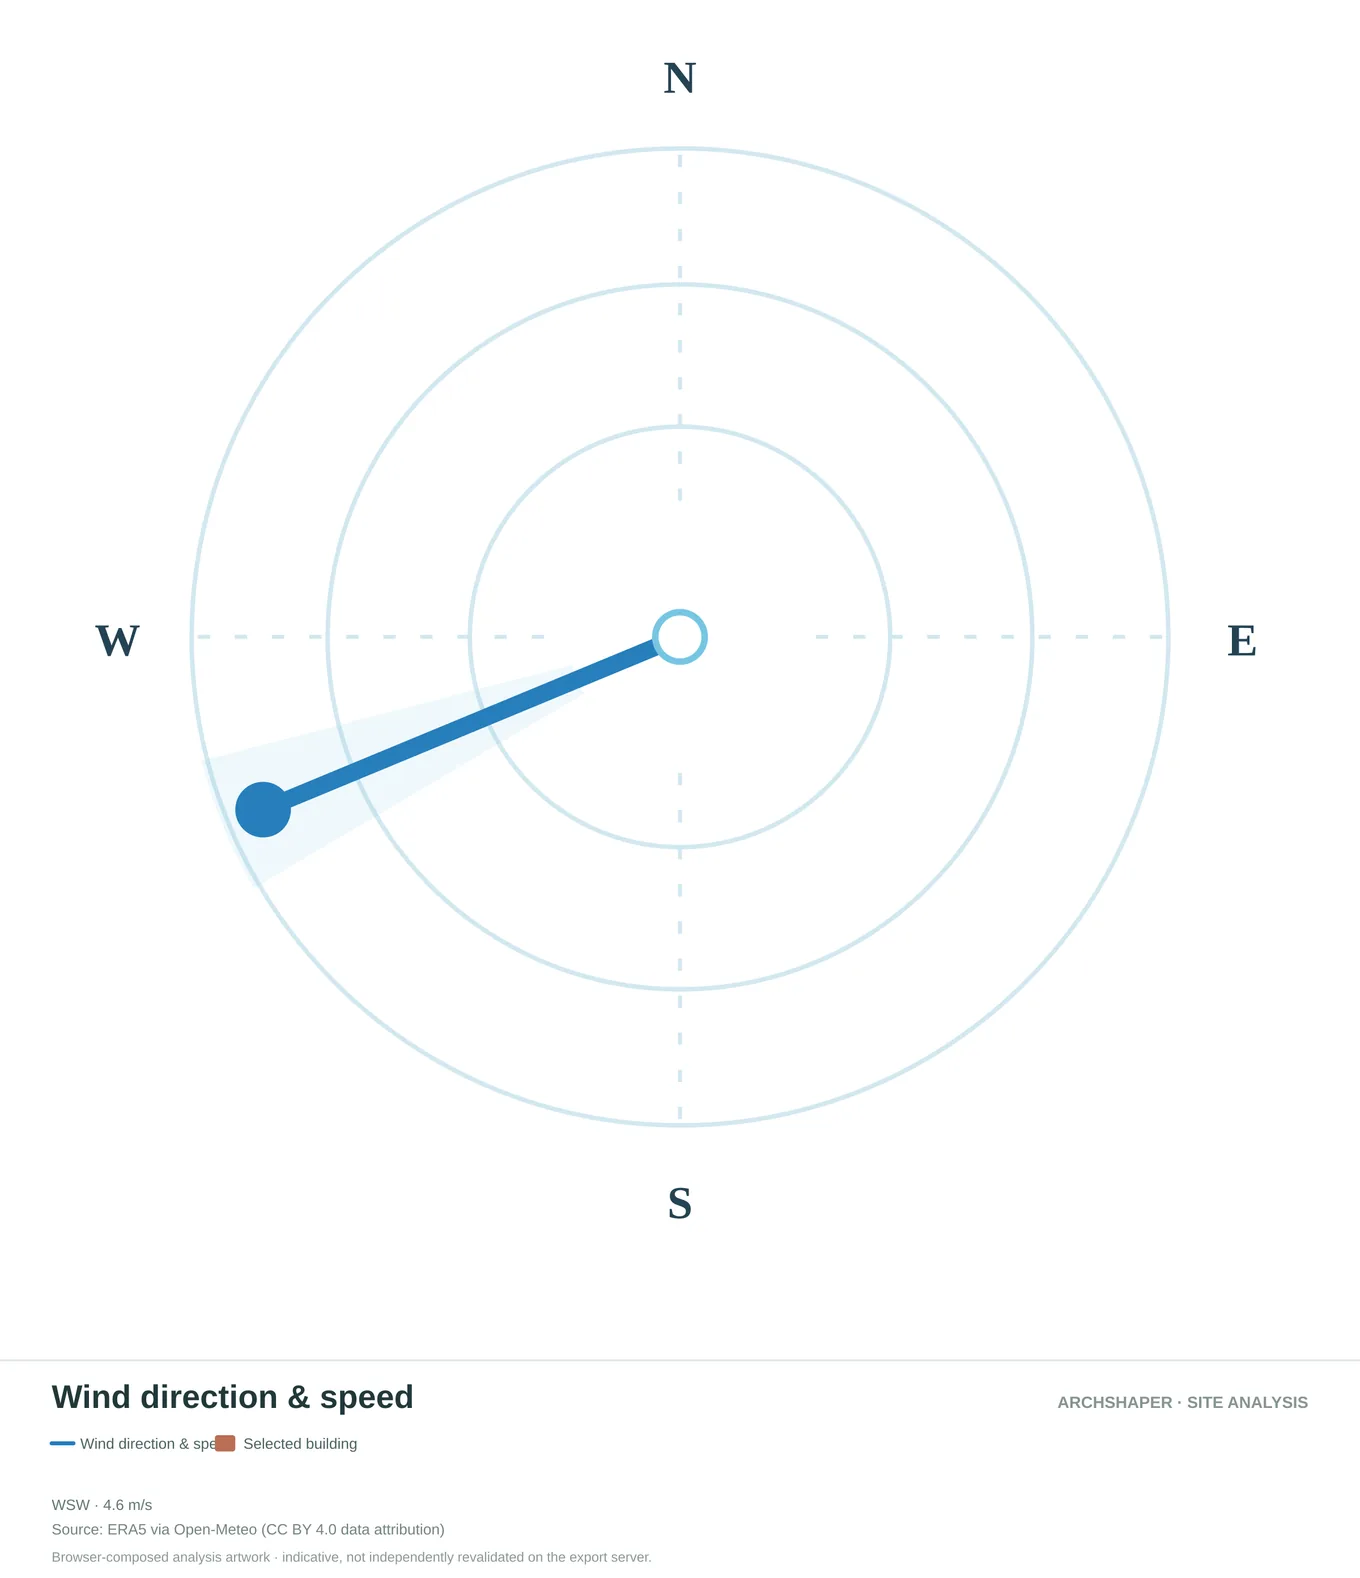
Directional regional wind information in a simplified polar view.
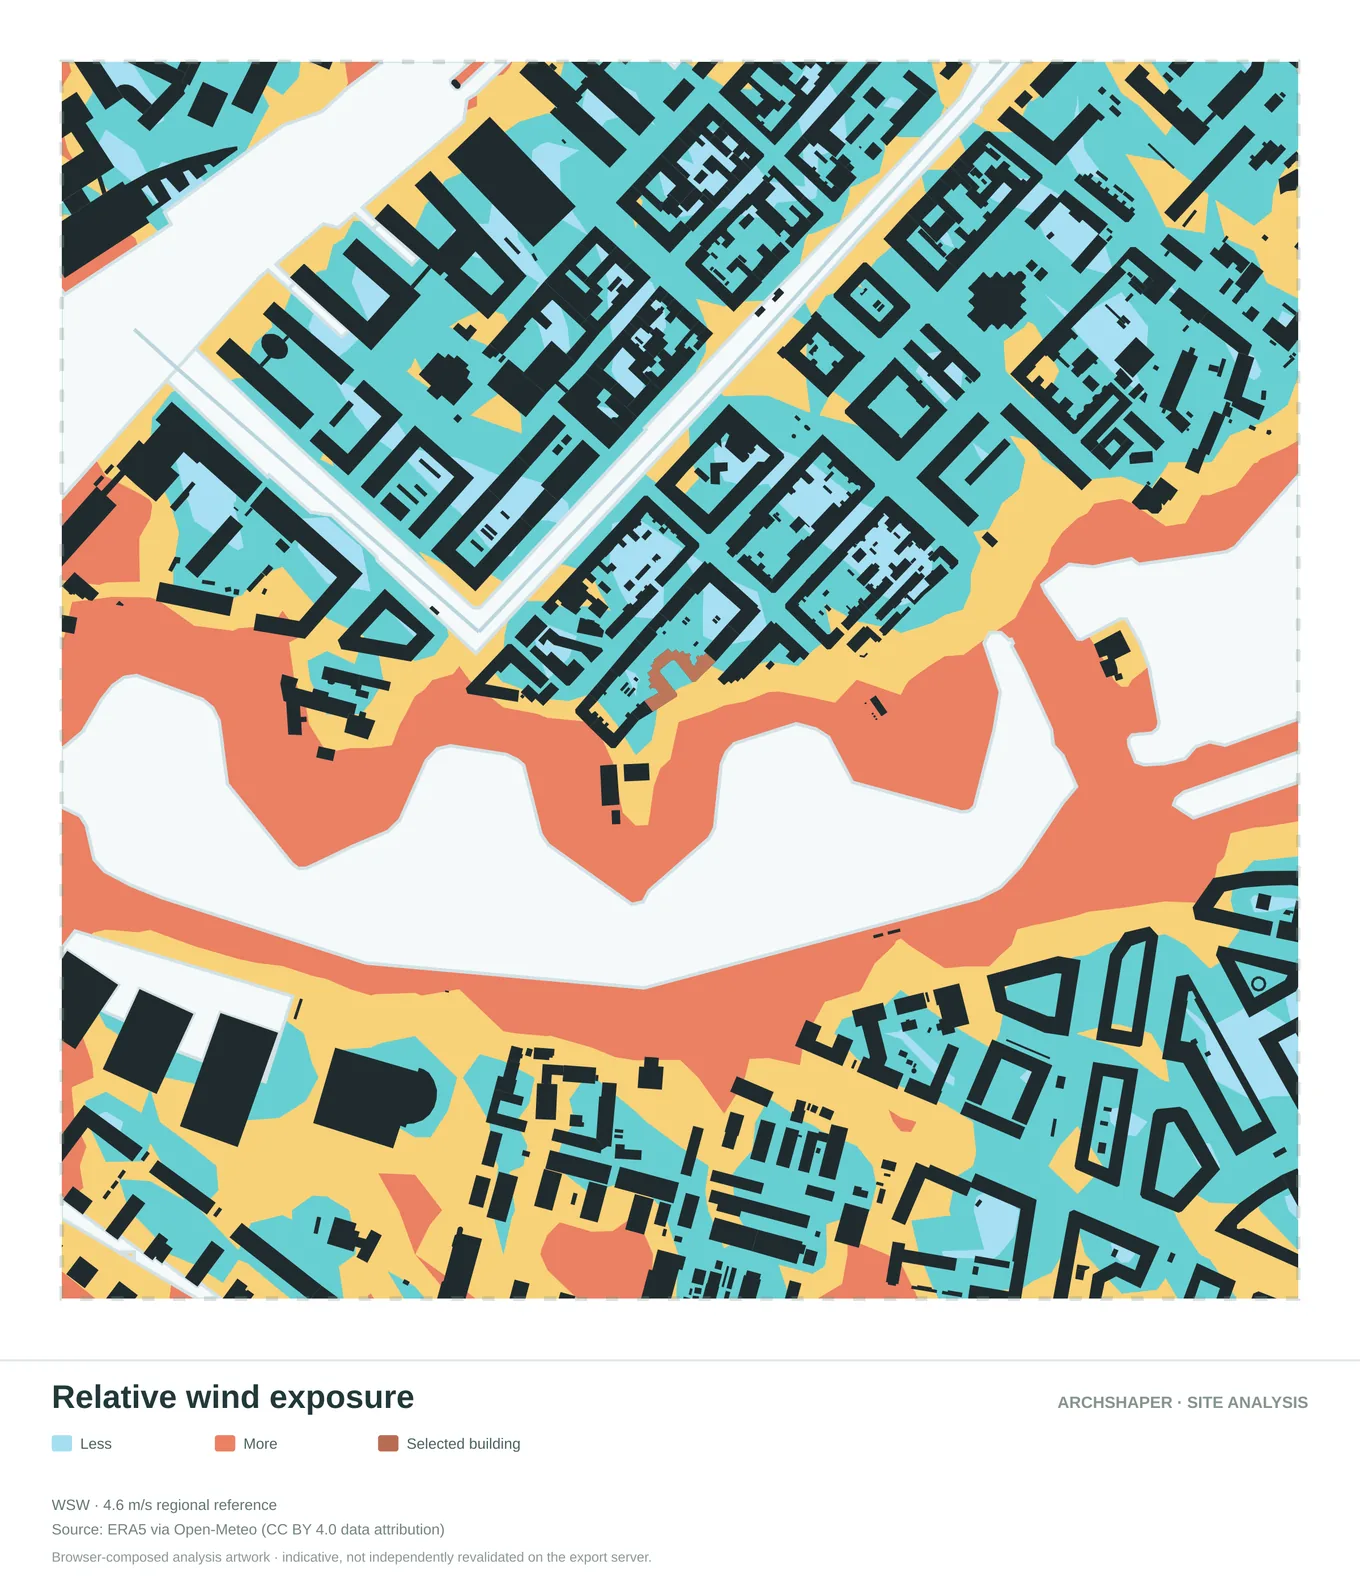
Compare mapped zones of lower and higher relative exposure.
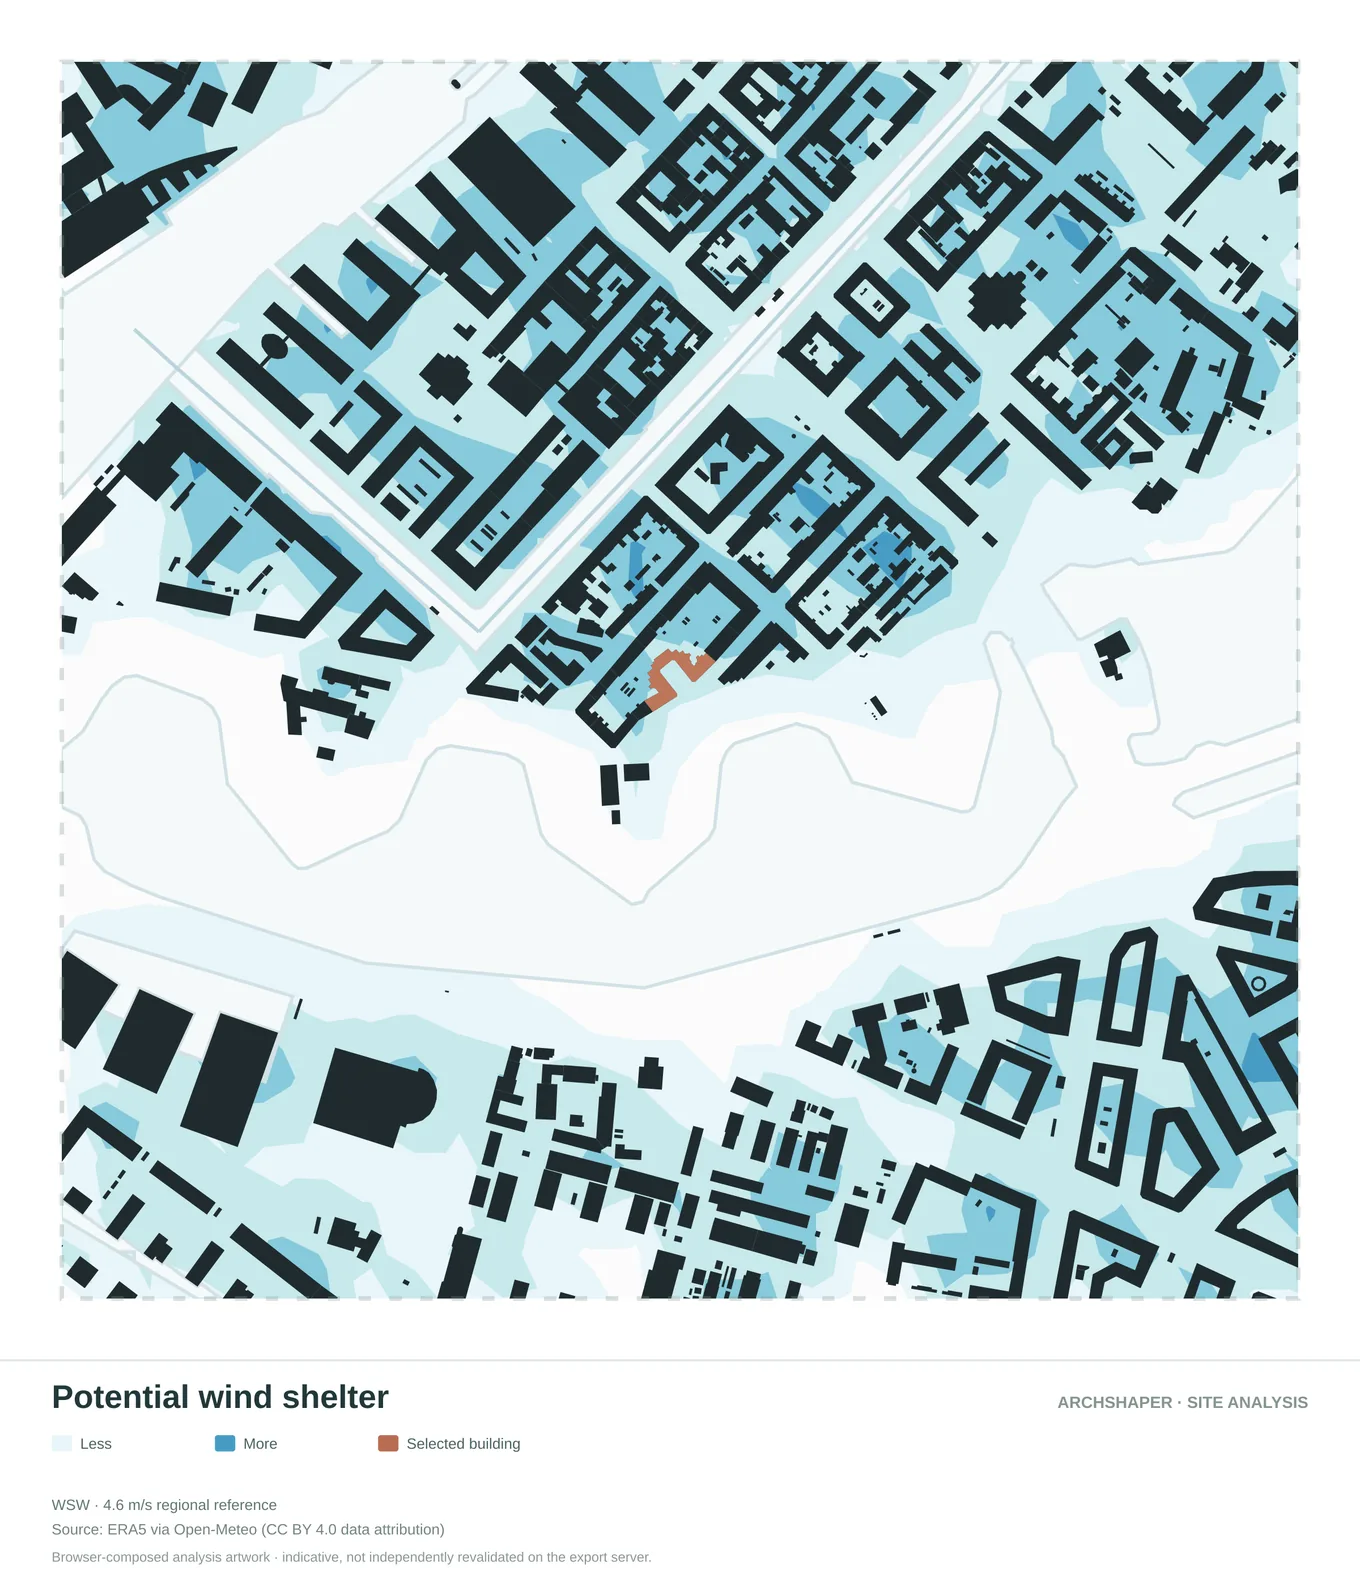
A diagram highlighting potential sheltered areas around the urban fabric.
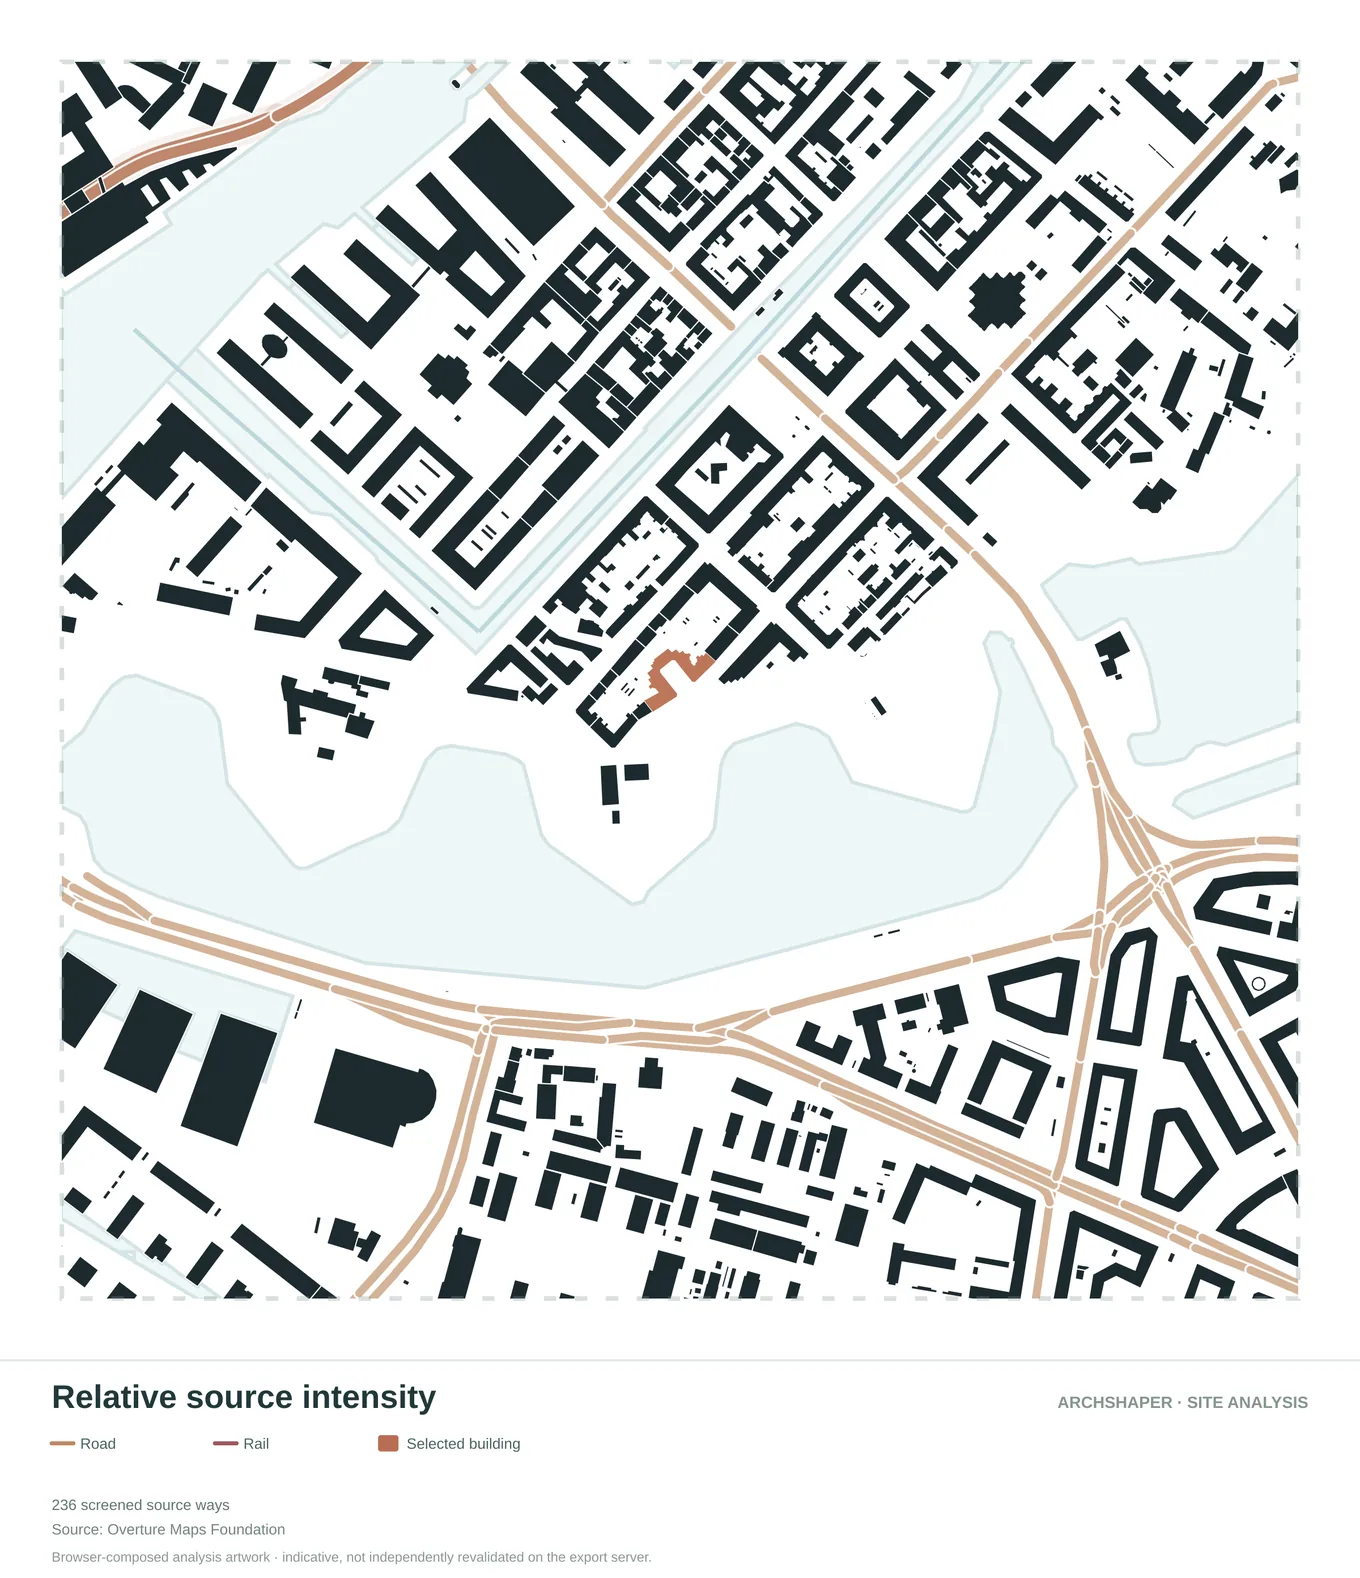
Illustrate potential noise influence around mapped routes and activity corridors.
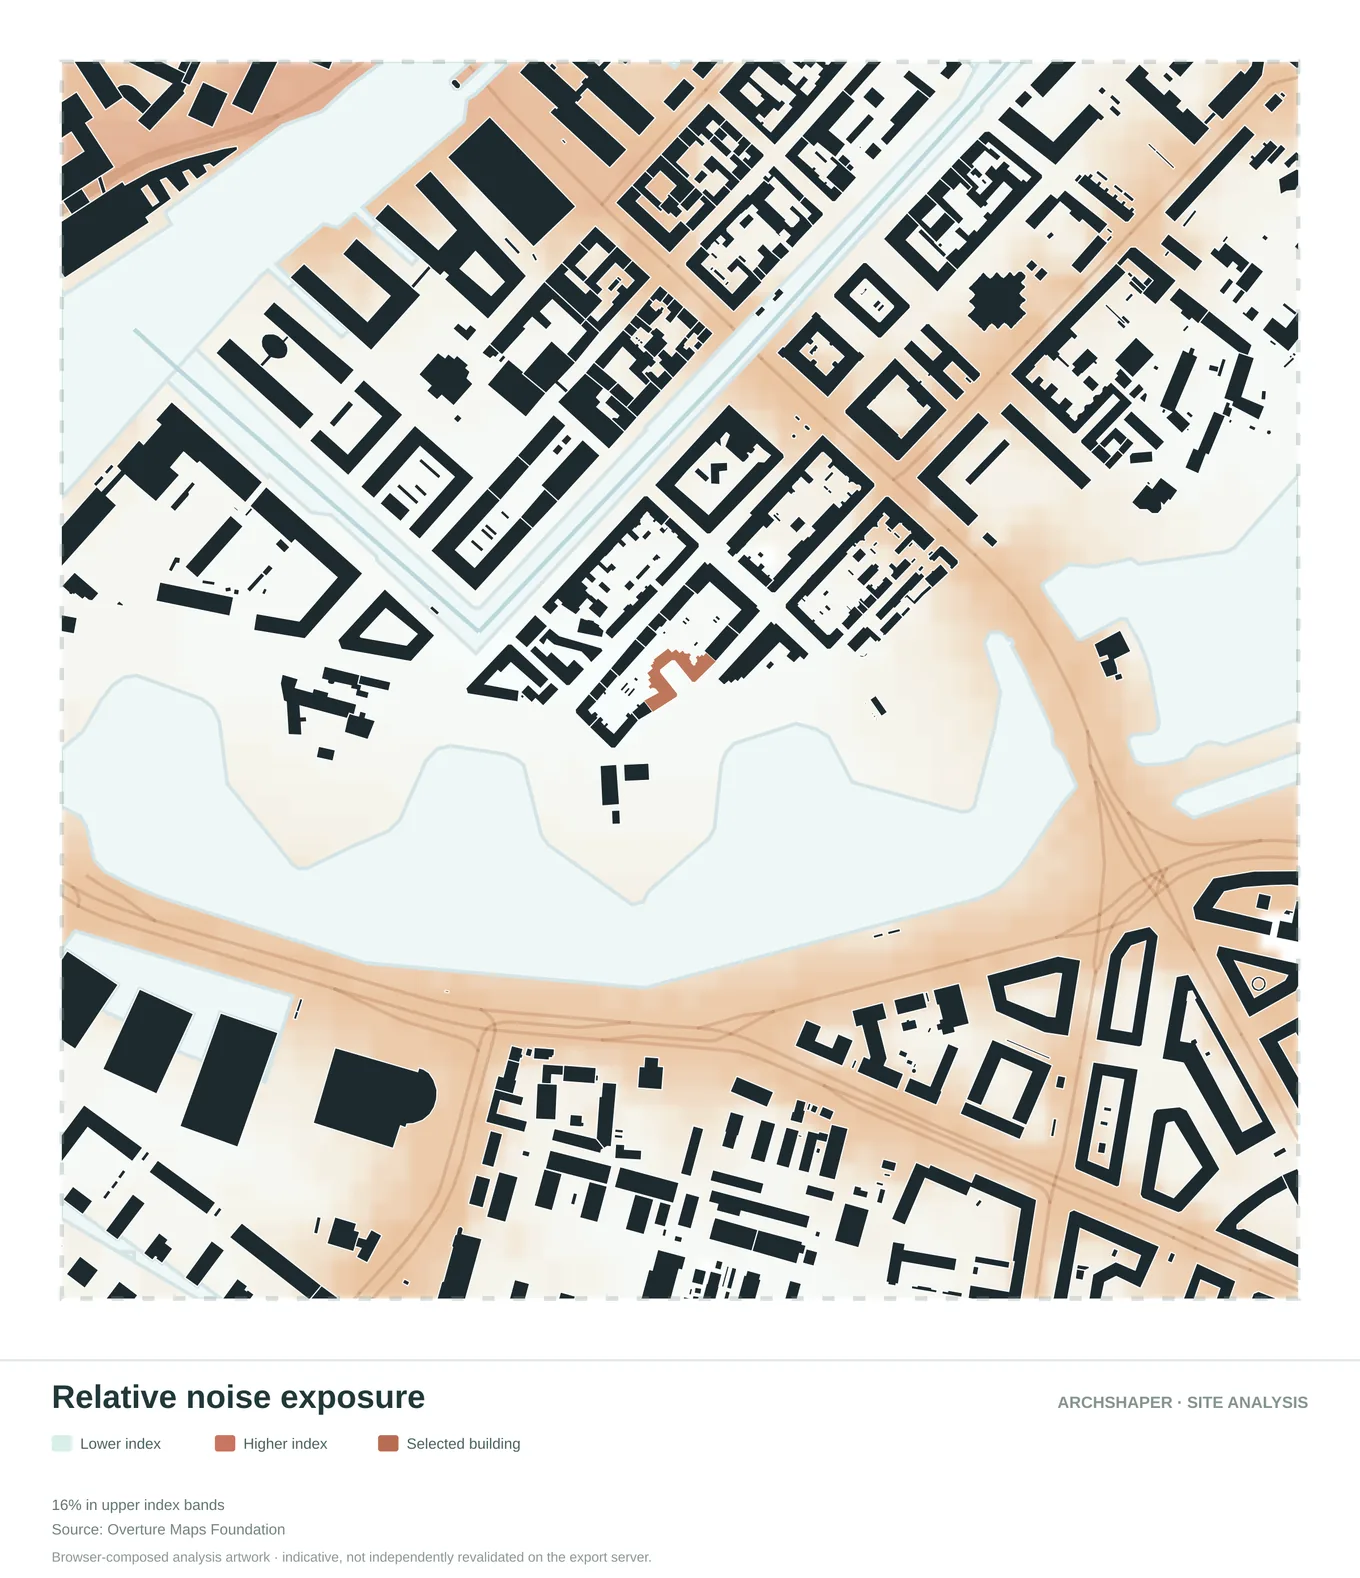
A relative visual comparison of exposure across the area.
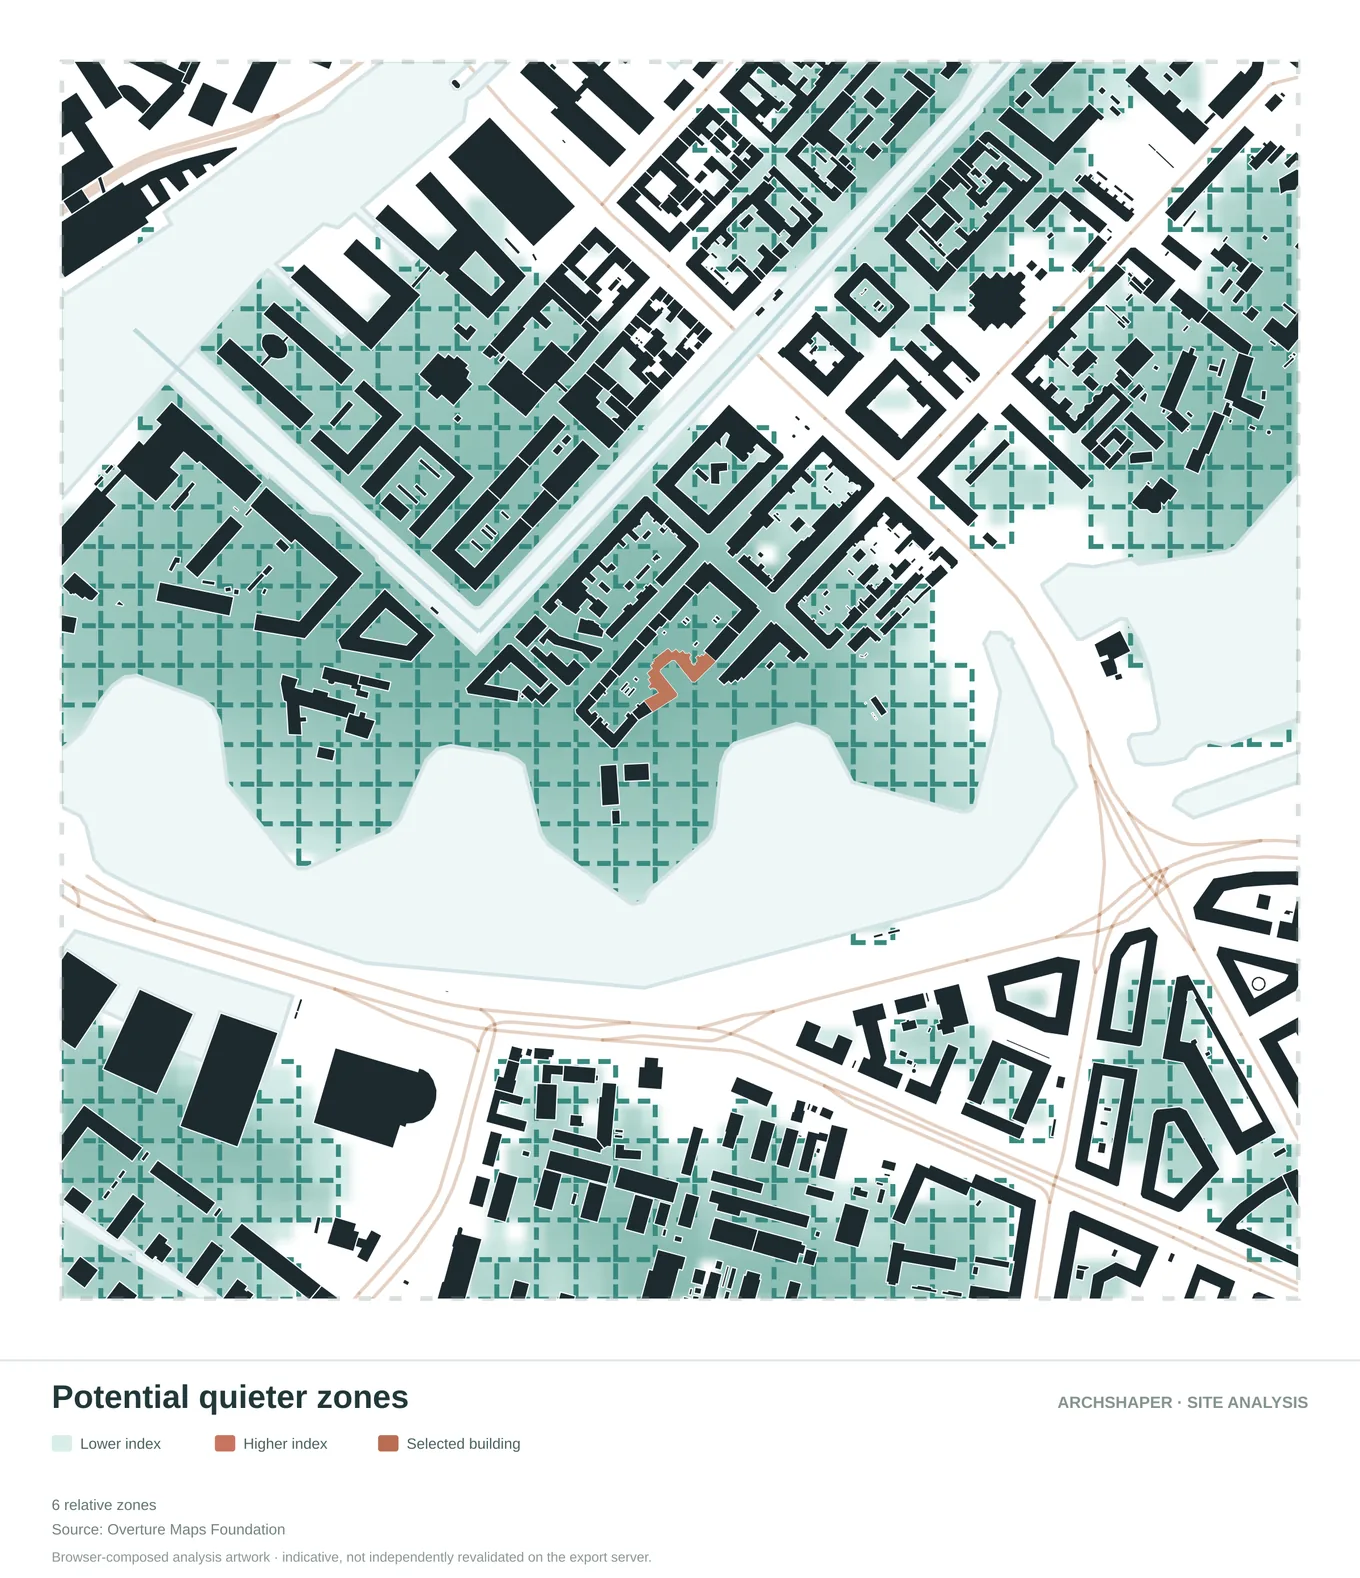
Highlight locations that may warrant closer acoustic investigation.
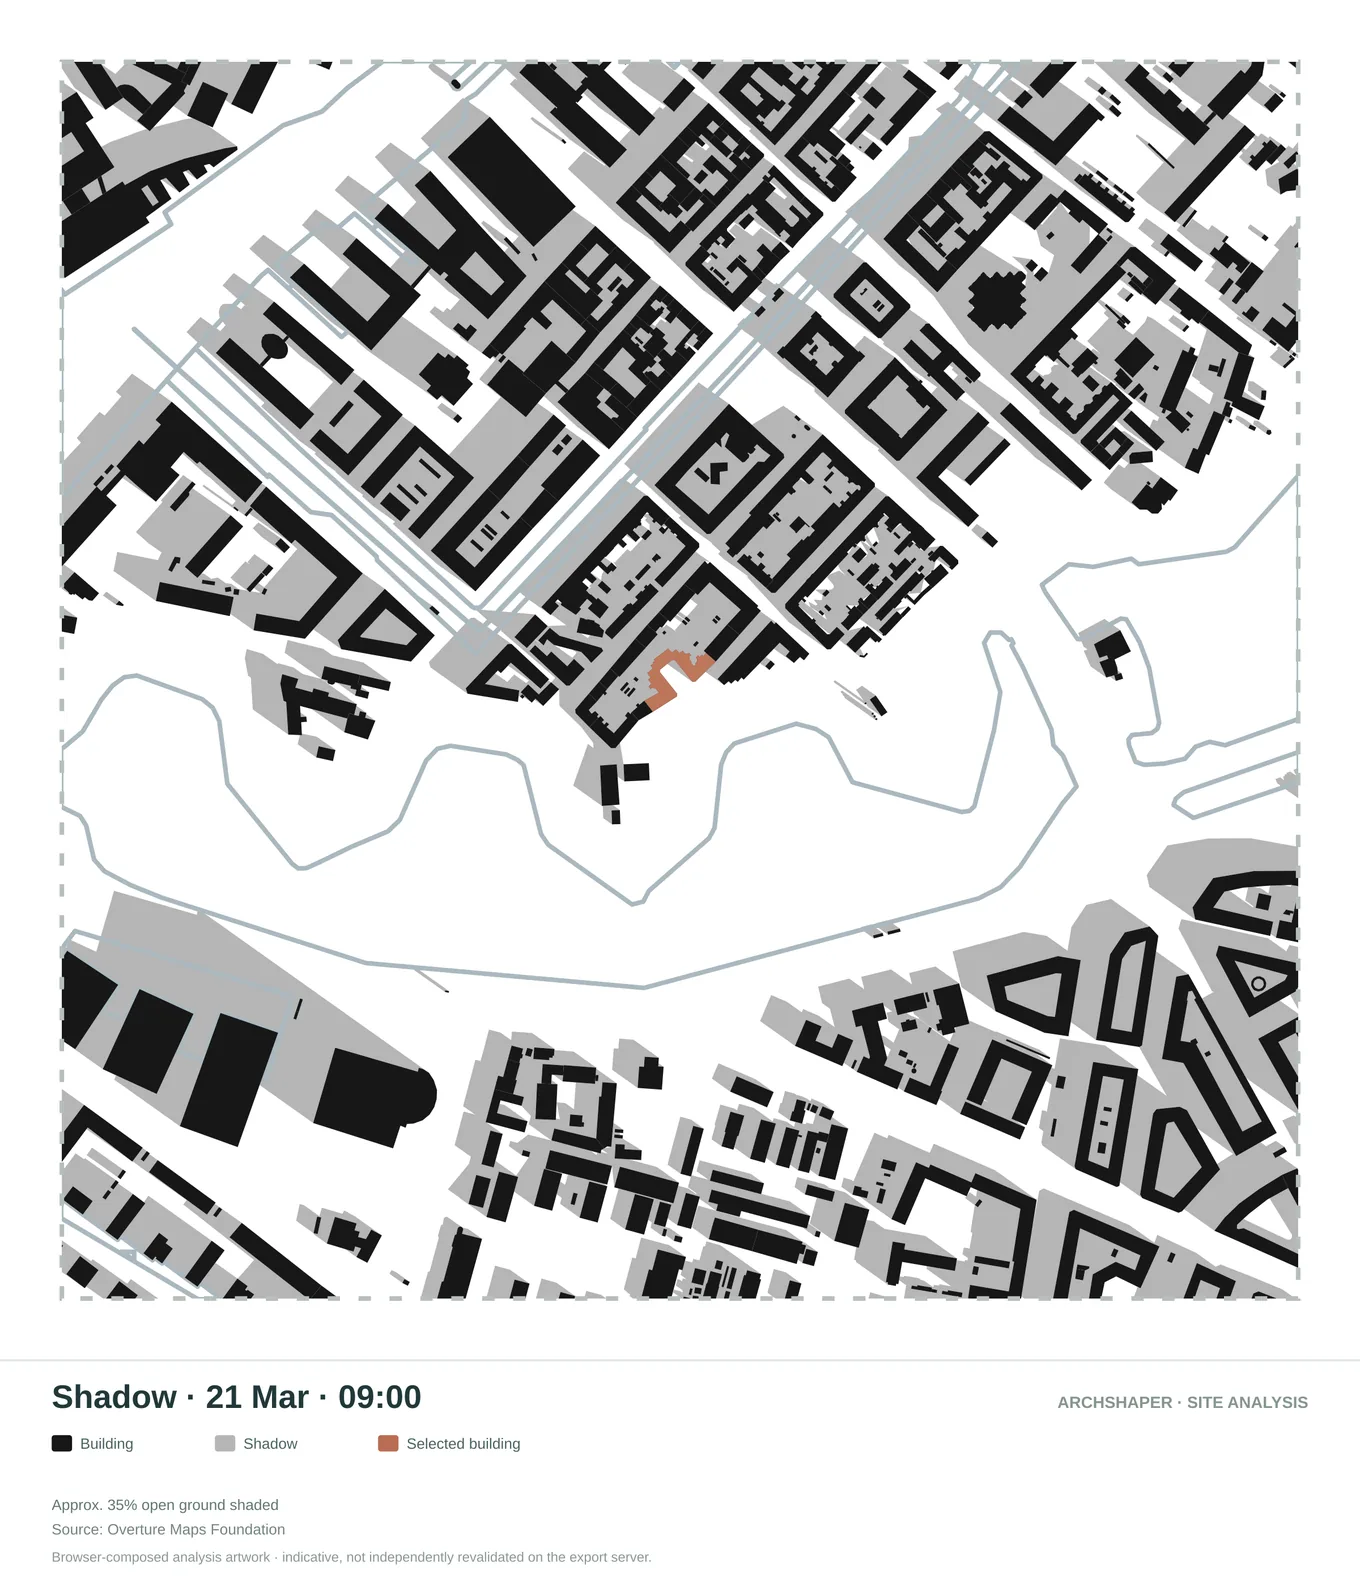
A selected morning shadow study for surrounding building mass.
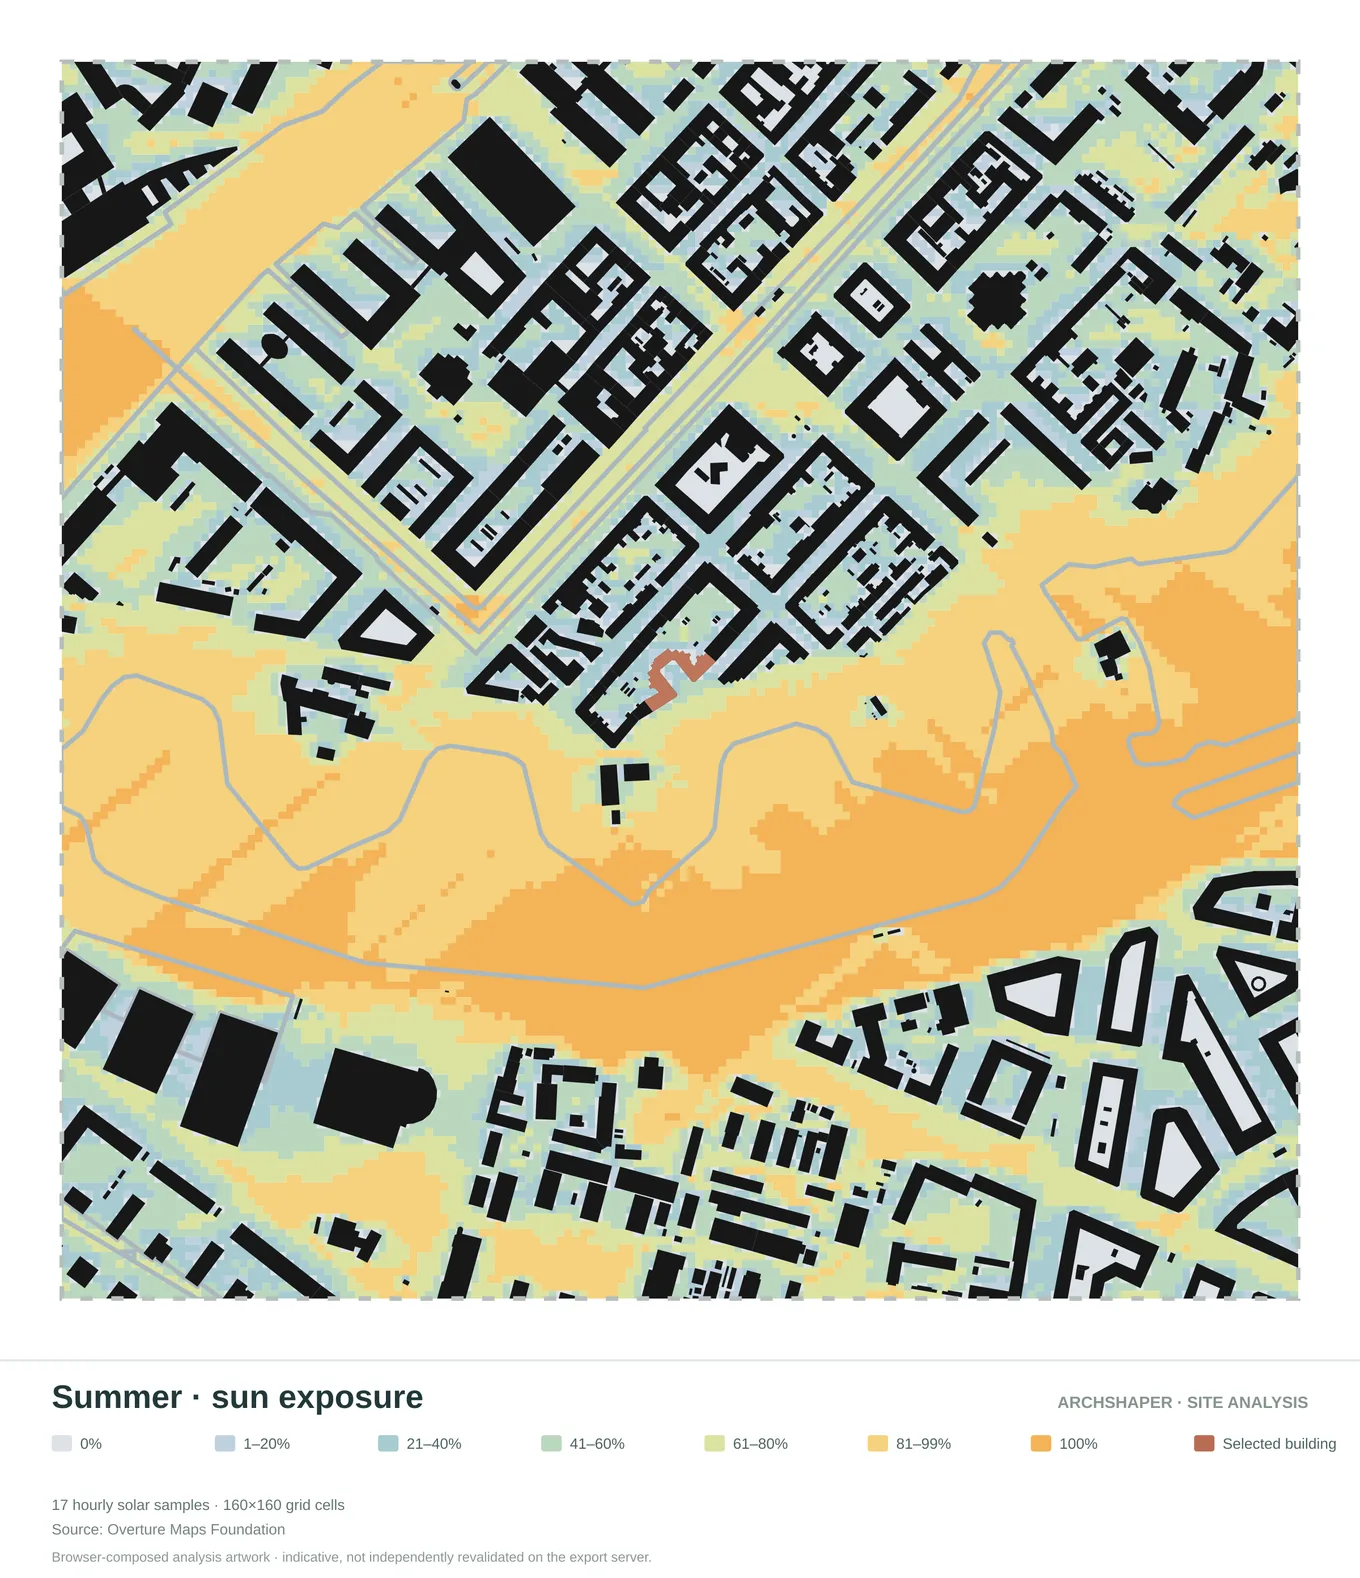
Illustrative sun-exposure patterns for a summer reference period.
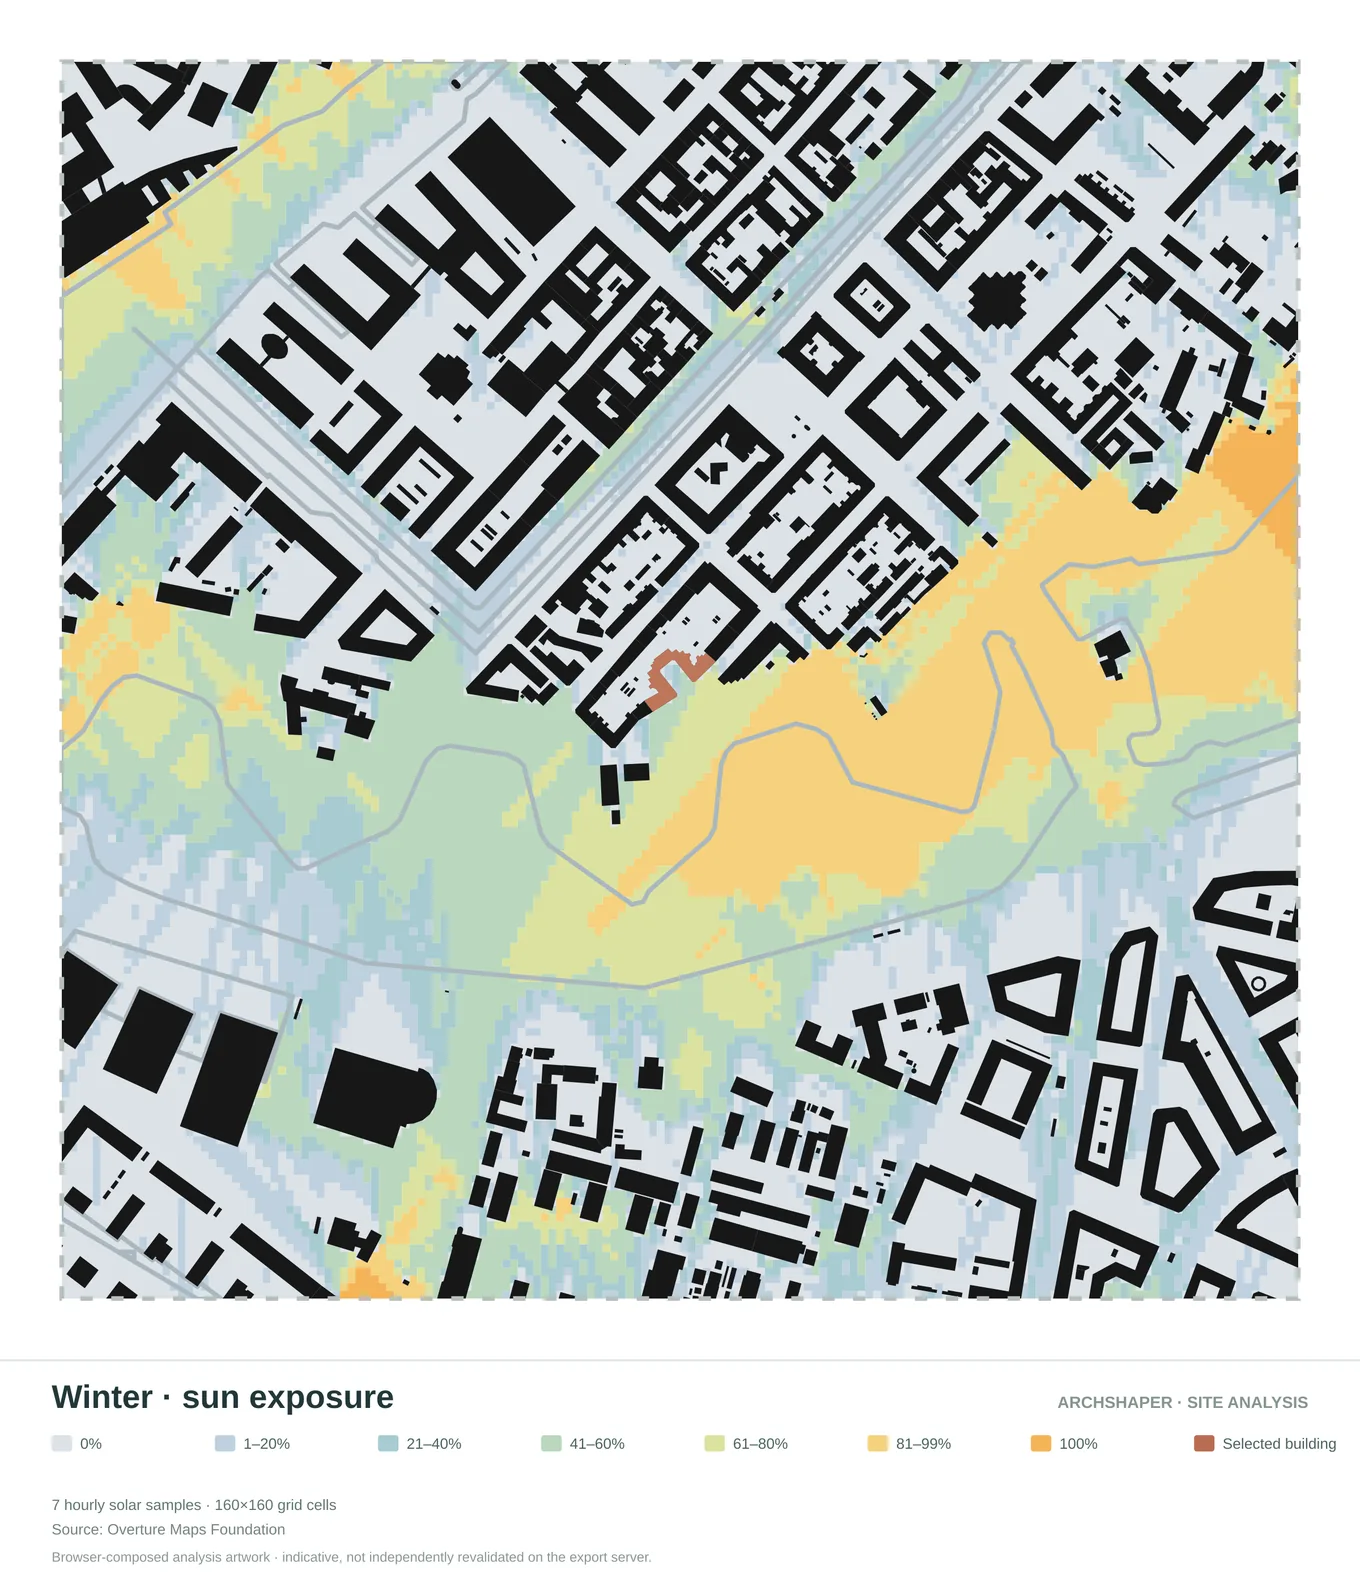
Illustrative sun-exposure patterns for a winter reference period.
How to read these diagrams
Sun and shadows
Explore selected solar and shadow conditions.
Wind
Read regional wind reference and relative exposure.
Movement and built form
Compare transport networks and surrounding building use.
What a good site analysis diagram shows
The best architectural diagrams communicate one condition clearly and use the same study extent so different views can be compared.
One site, several studies
Choose a location, review available maps, read their source notes and choose the diagrams relevant to your brief.
From site research to presentation
Use diagrams to support concept boards and portfolios, while verifying mapped and technical information independently.
Frequently asked questions
Can I compare diagrams for the same site?
Yes. Use the Site Analysis workspace to review available categories from a common location.
Can I export diagrams?
The editor shows the available formats and current credit requirement before export.
Is this a technical survey?
No. It is a preliminary site analysis and presentation workflow.