Make each diagram part of a bigger story
A convincing site analysis presentation does more than arrange attractive maps. It shows how each drawing supports a question about the design. These examples use genuine Archshaper outputs to demonstrate how an architect can group complementary diagrams into an evidence-led narrative.
01 / Read the surrounding urban fabric
How does a proposed building relate to the blocks, access routes and surrounding uses?
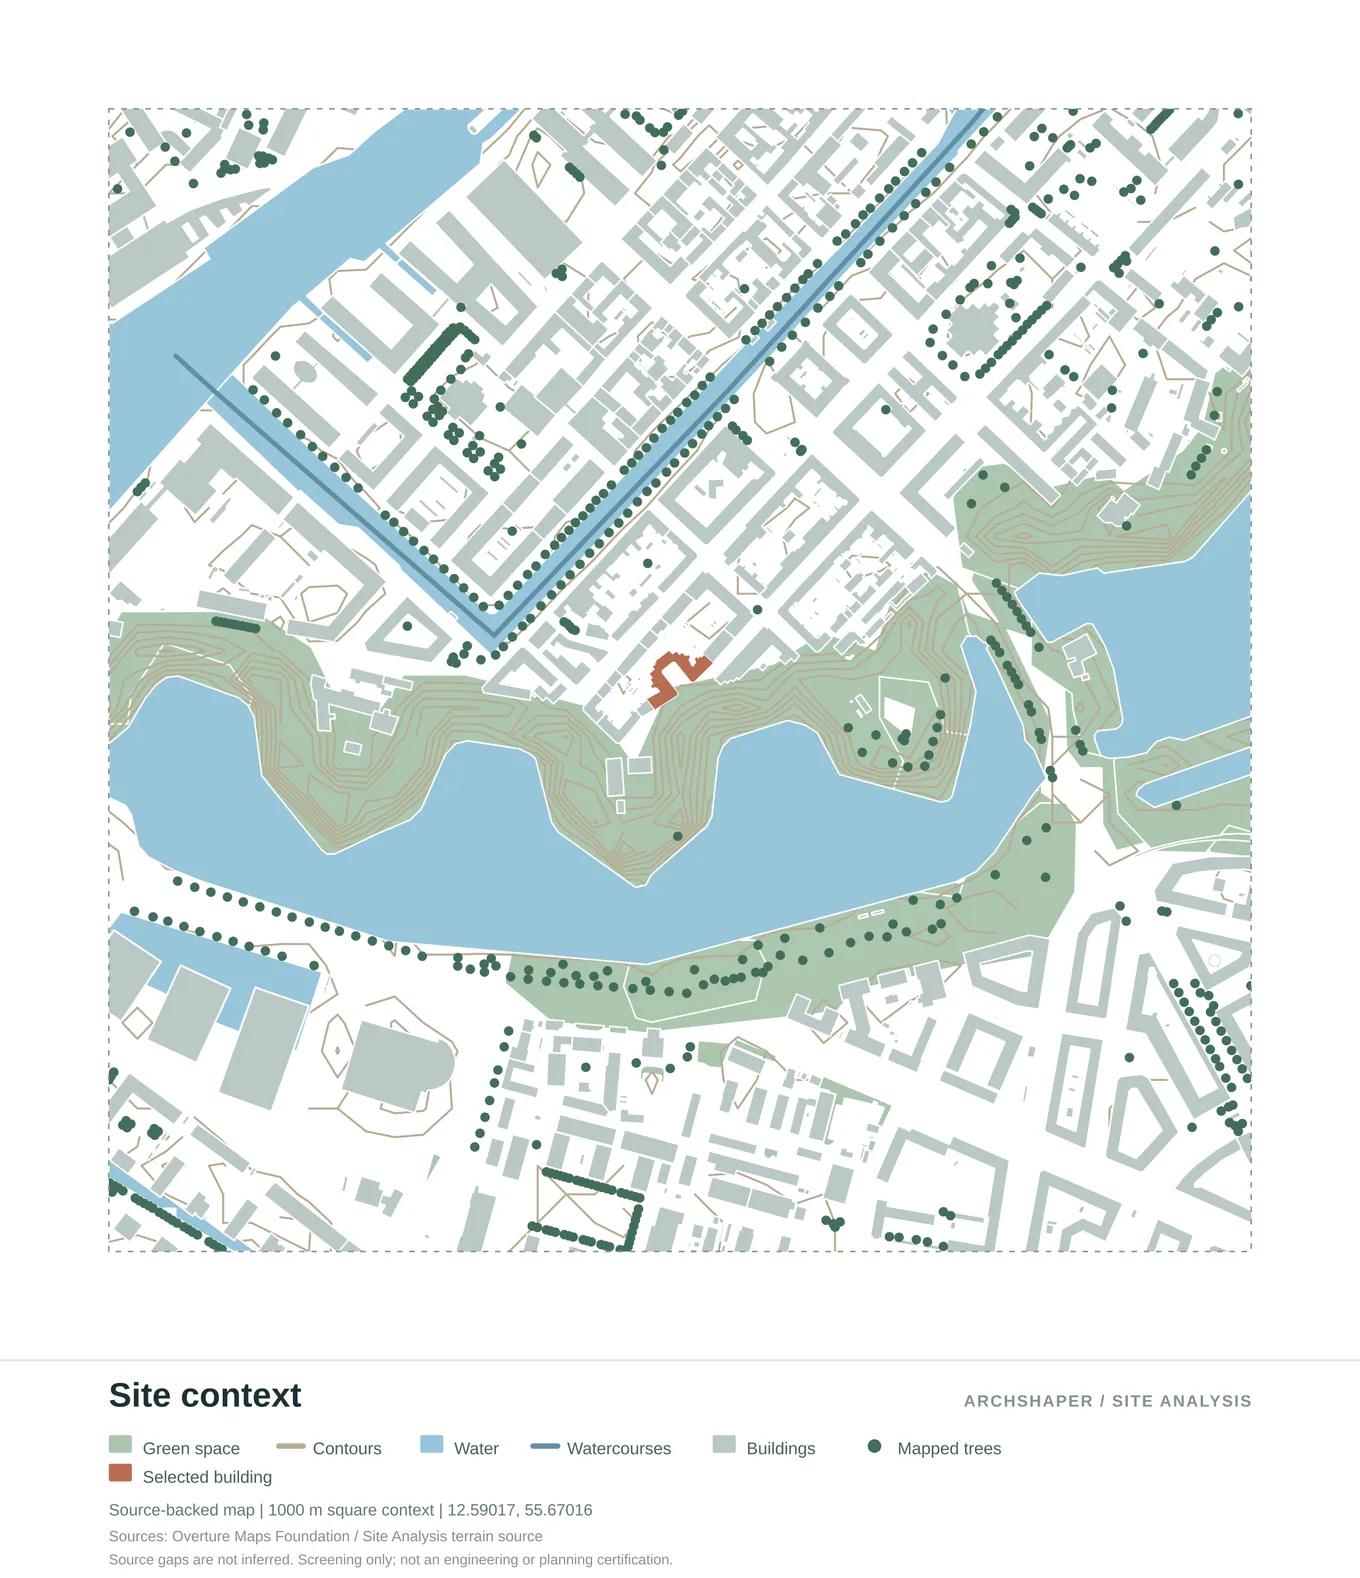
Buildings, streets, landscape, waterways and the selected project site in one map.
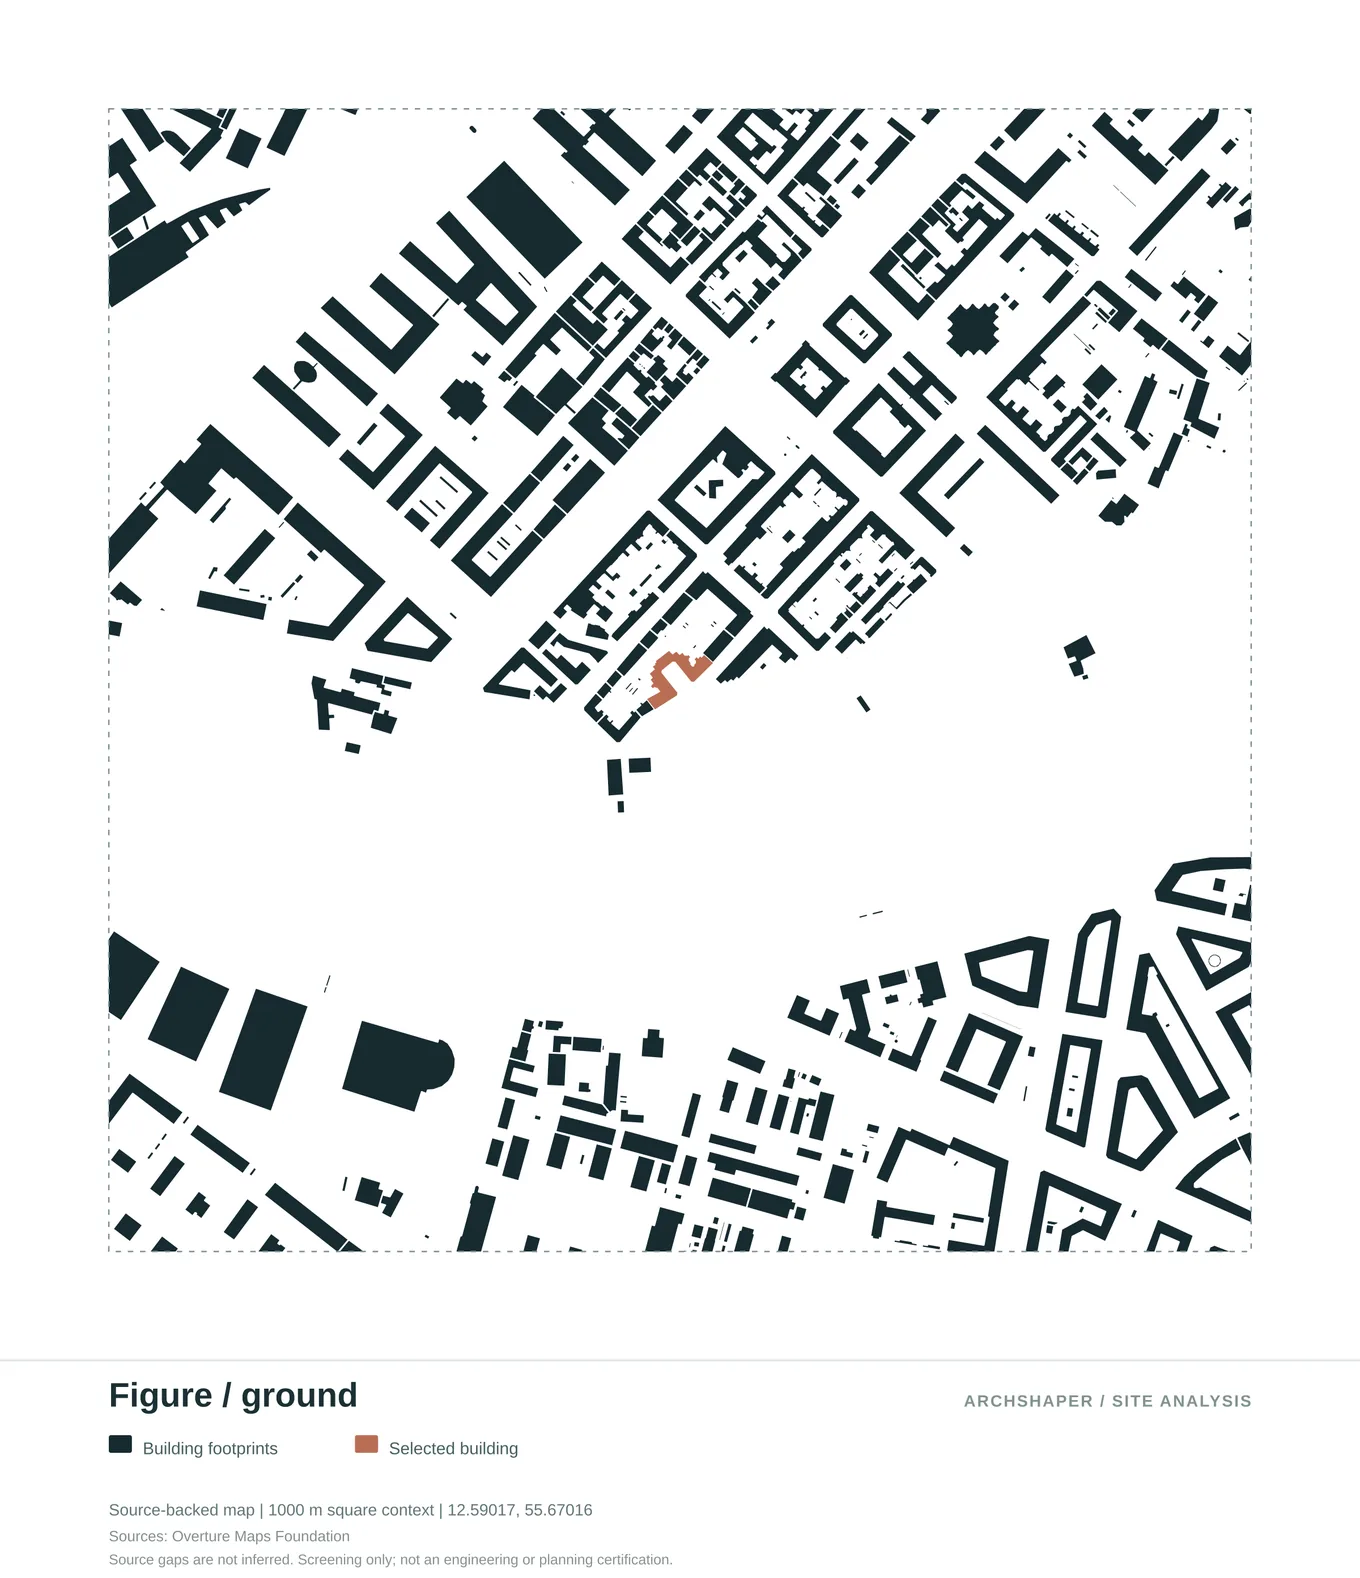
A simplified map of built mass and open space around the project site.
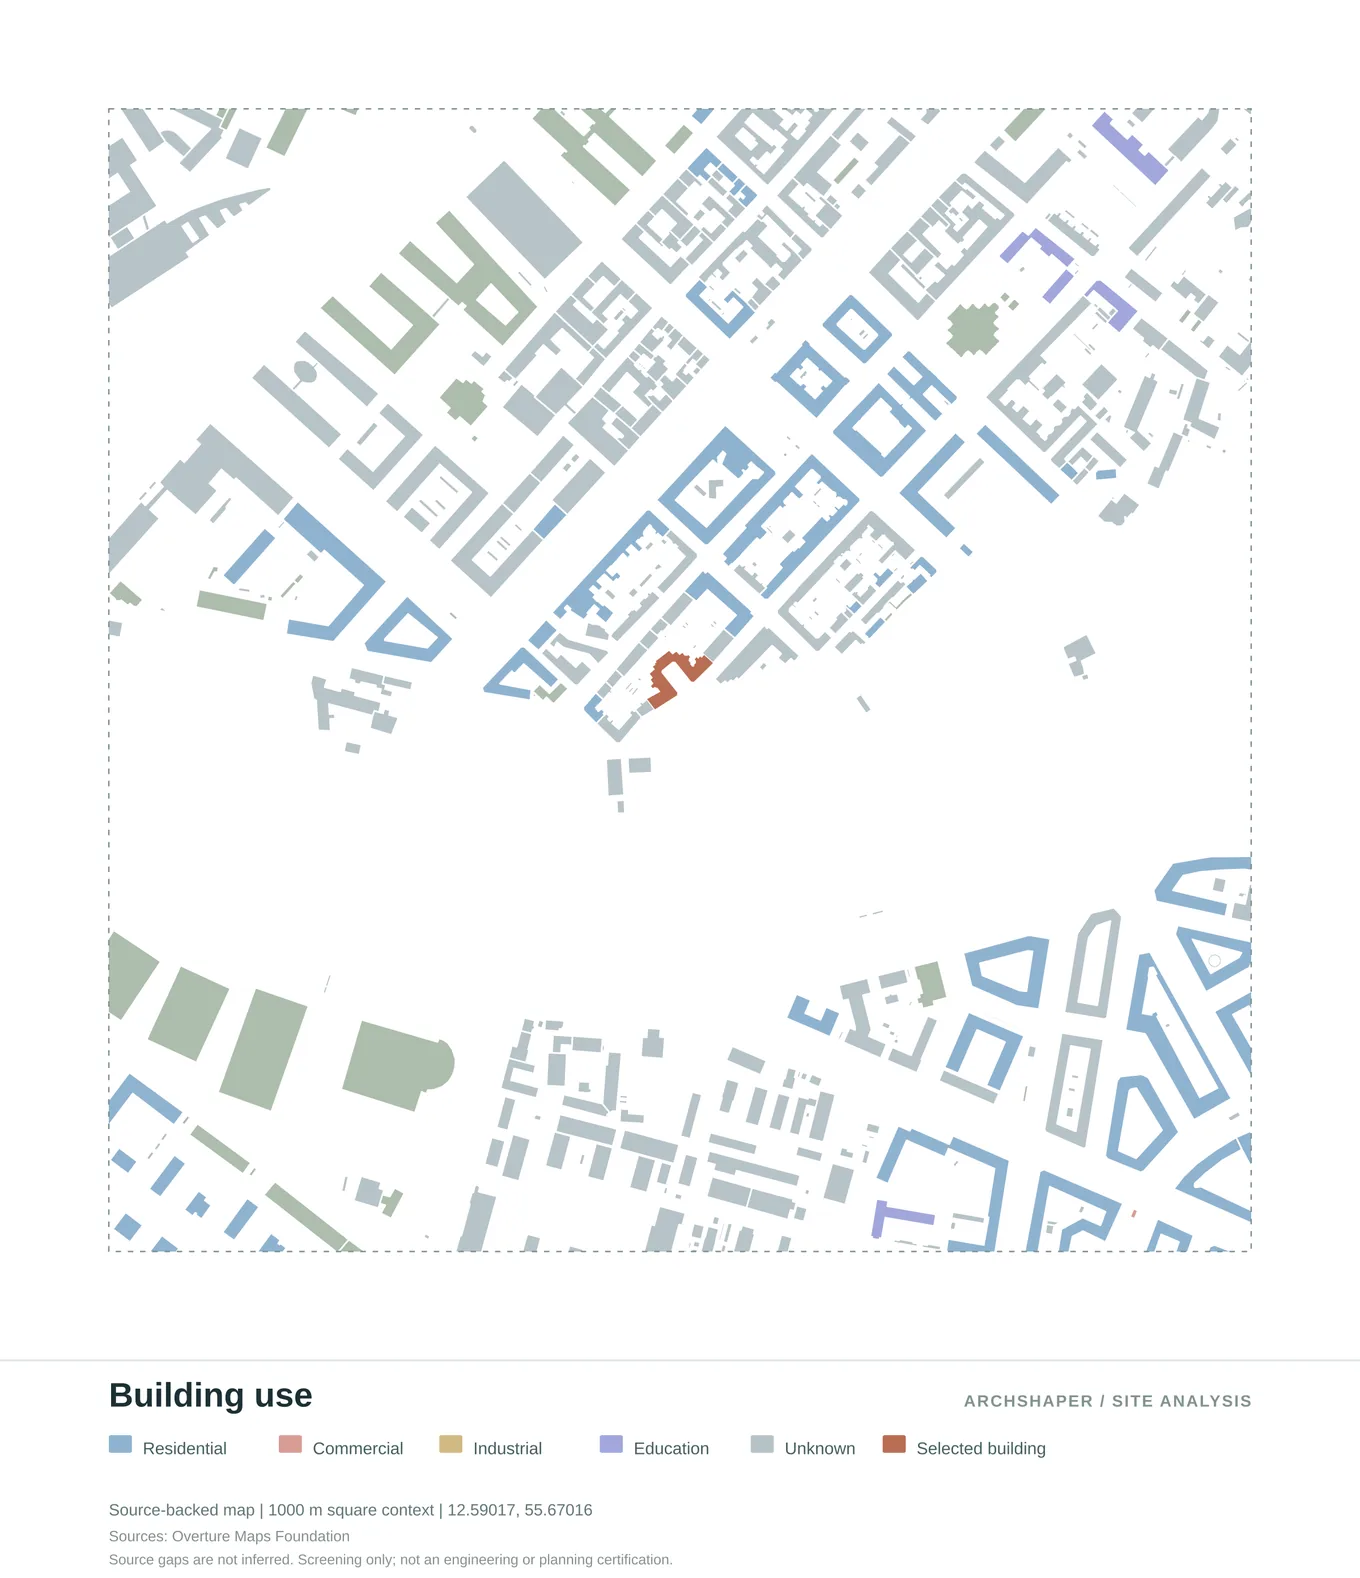
Mapped building functions with a clear colour-coded legend.
What these diagrams can help communicate
Use a context map to orient the viewer, a figure-ground drawing to reveal building mass and public voids, and a building-use diagram to discuss the character of surrounding activity.
02 / Understand environmental pressures
Where should an early design team investigate comfort, exposure or shading?
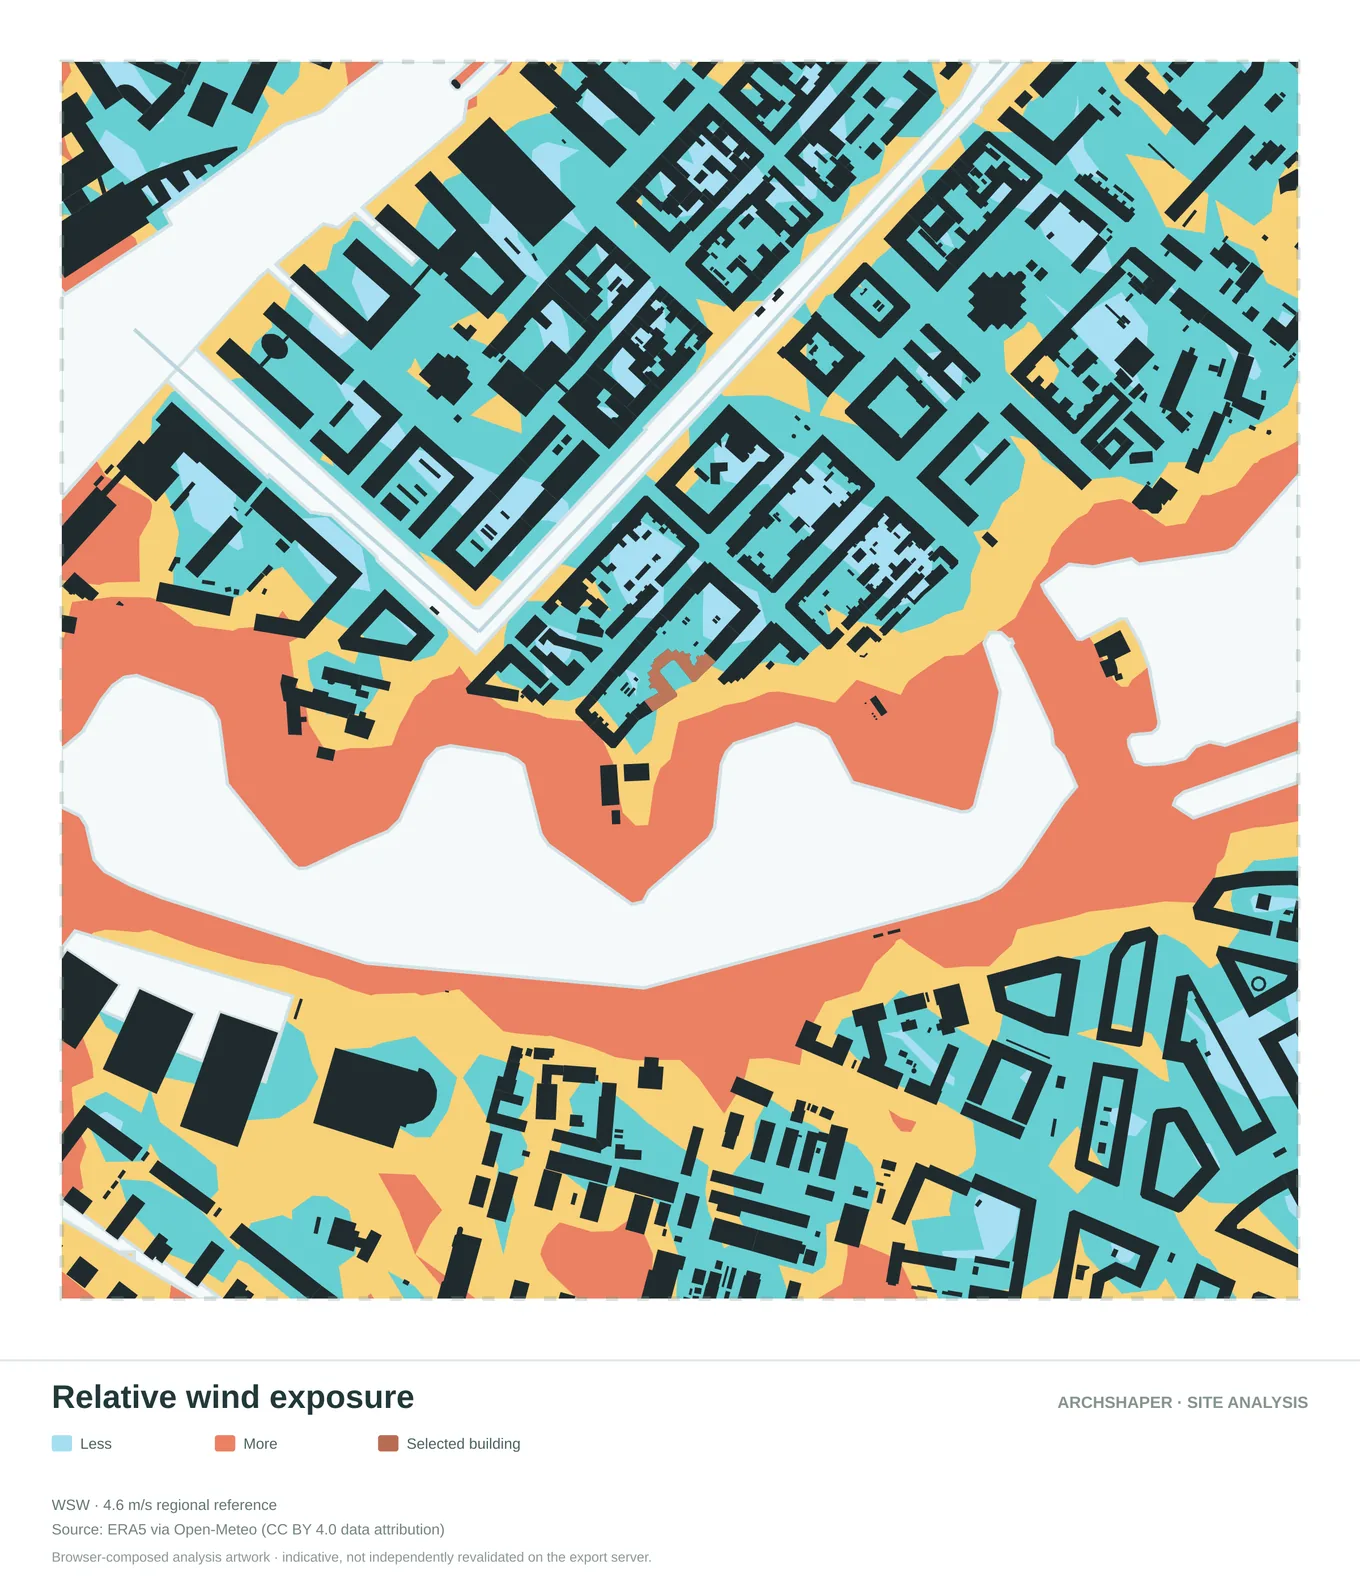
Compare mapped zones of lower and higher relative exposure.
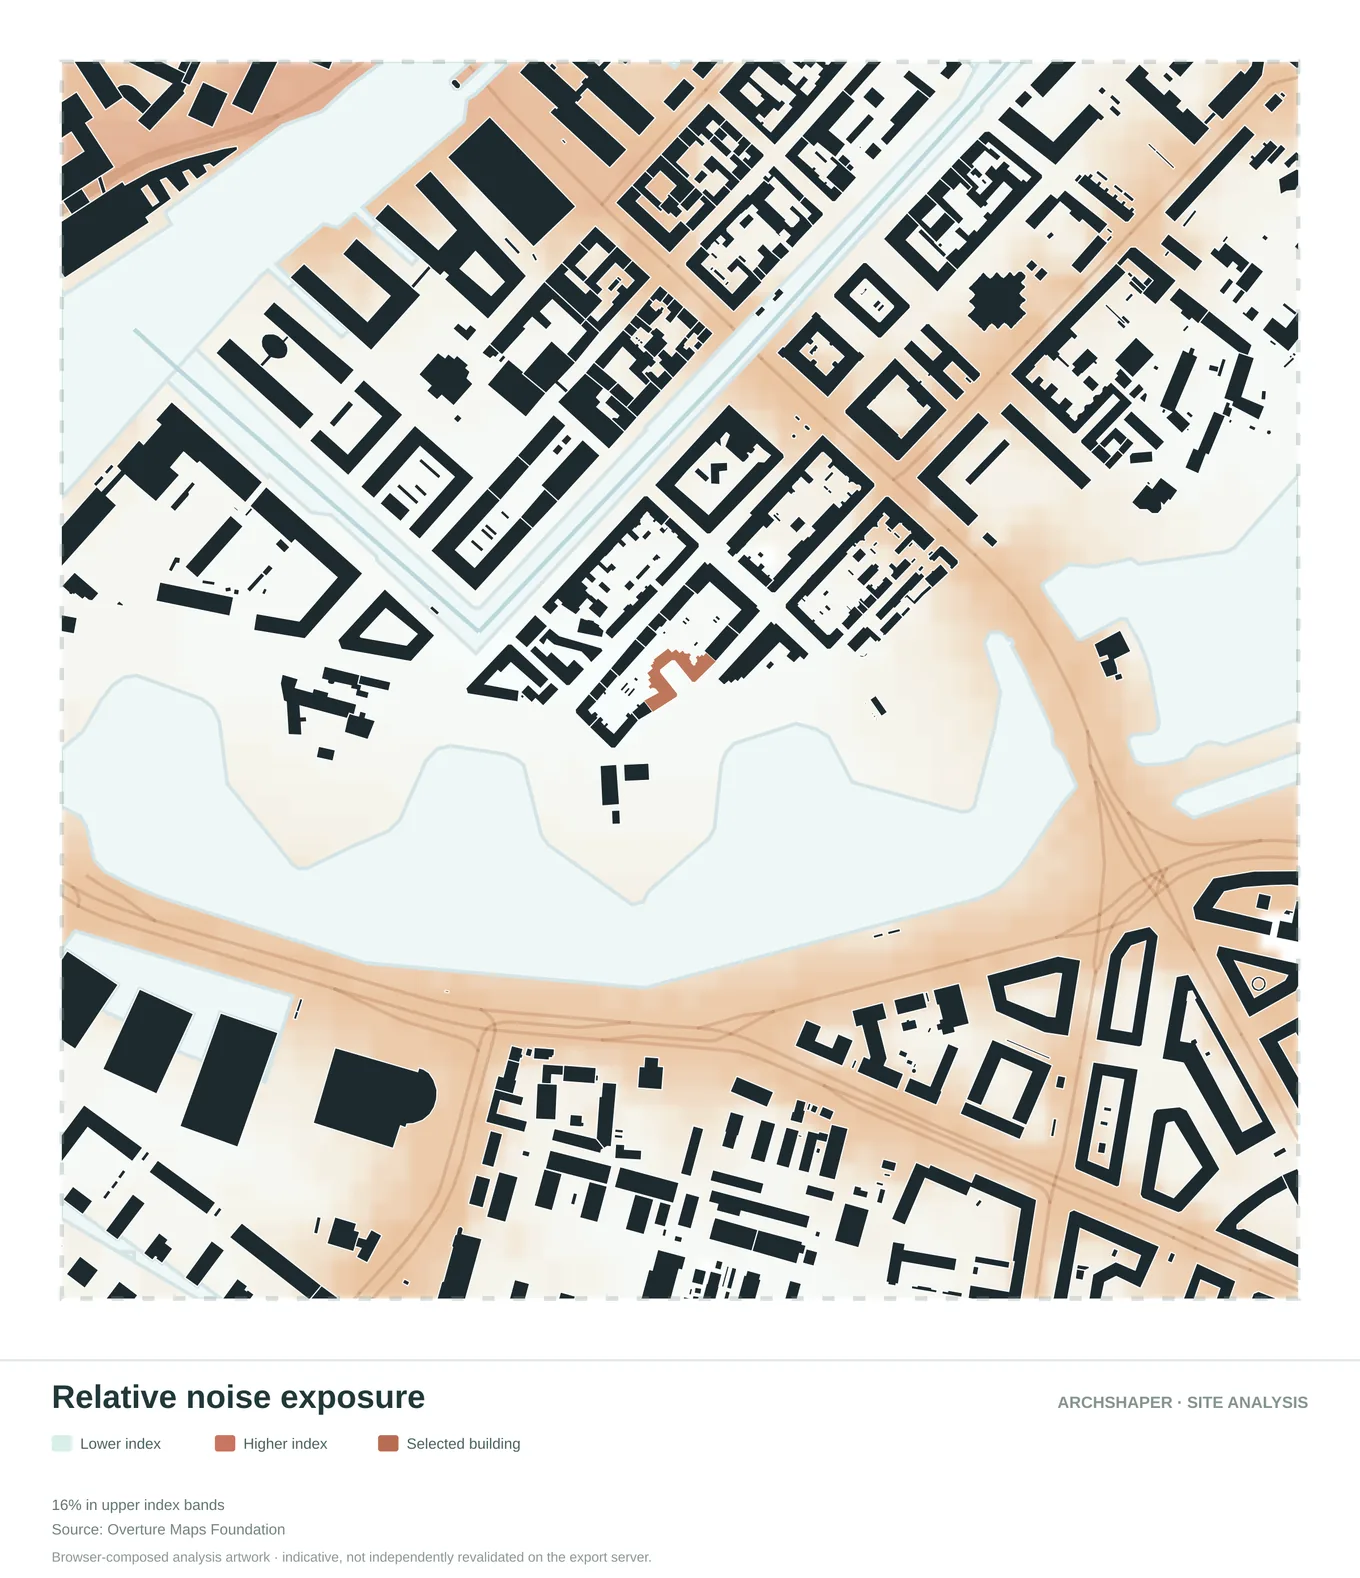
A relative visual comparison of exposure across the area.
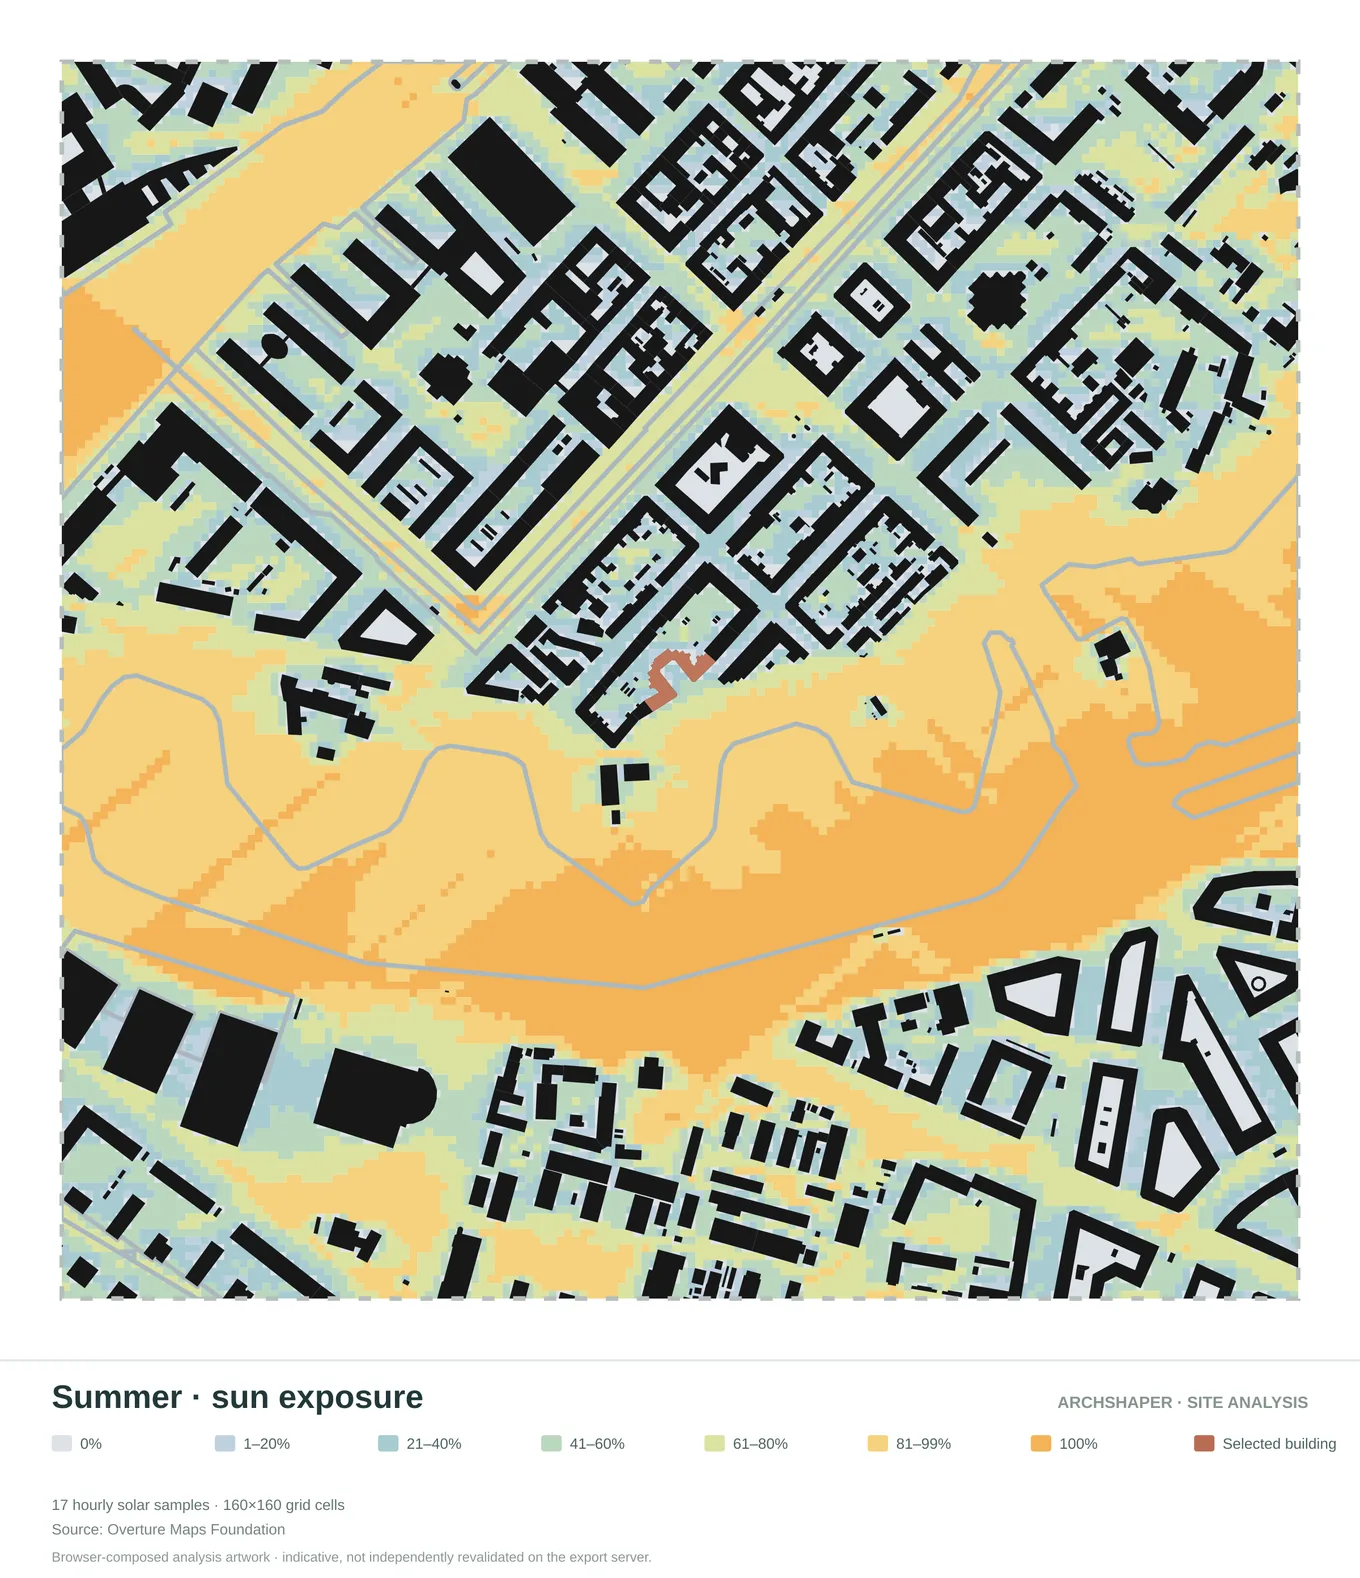
Illustrative sun-exposure patterns for a summer reference period.
What these diagrams can help communicate
Put the wind, noise and sunlight drawings next to each other with consistent site references. Treat their patterns as prompts for investigation, not verified performance figures.
03 / Explain the landscape setting
What do waterways, vegetation and relief contribute to the site's spatial identity?
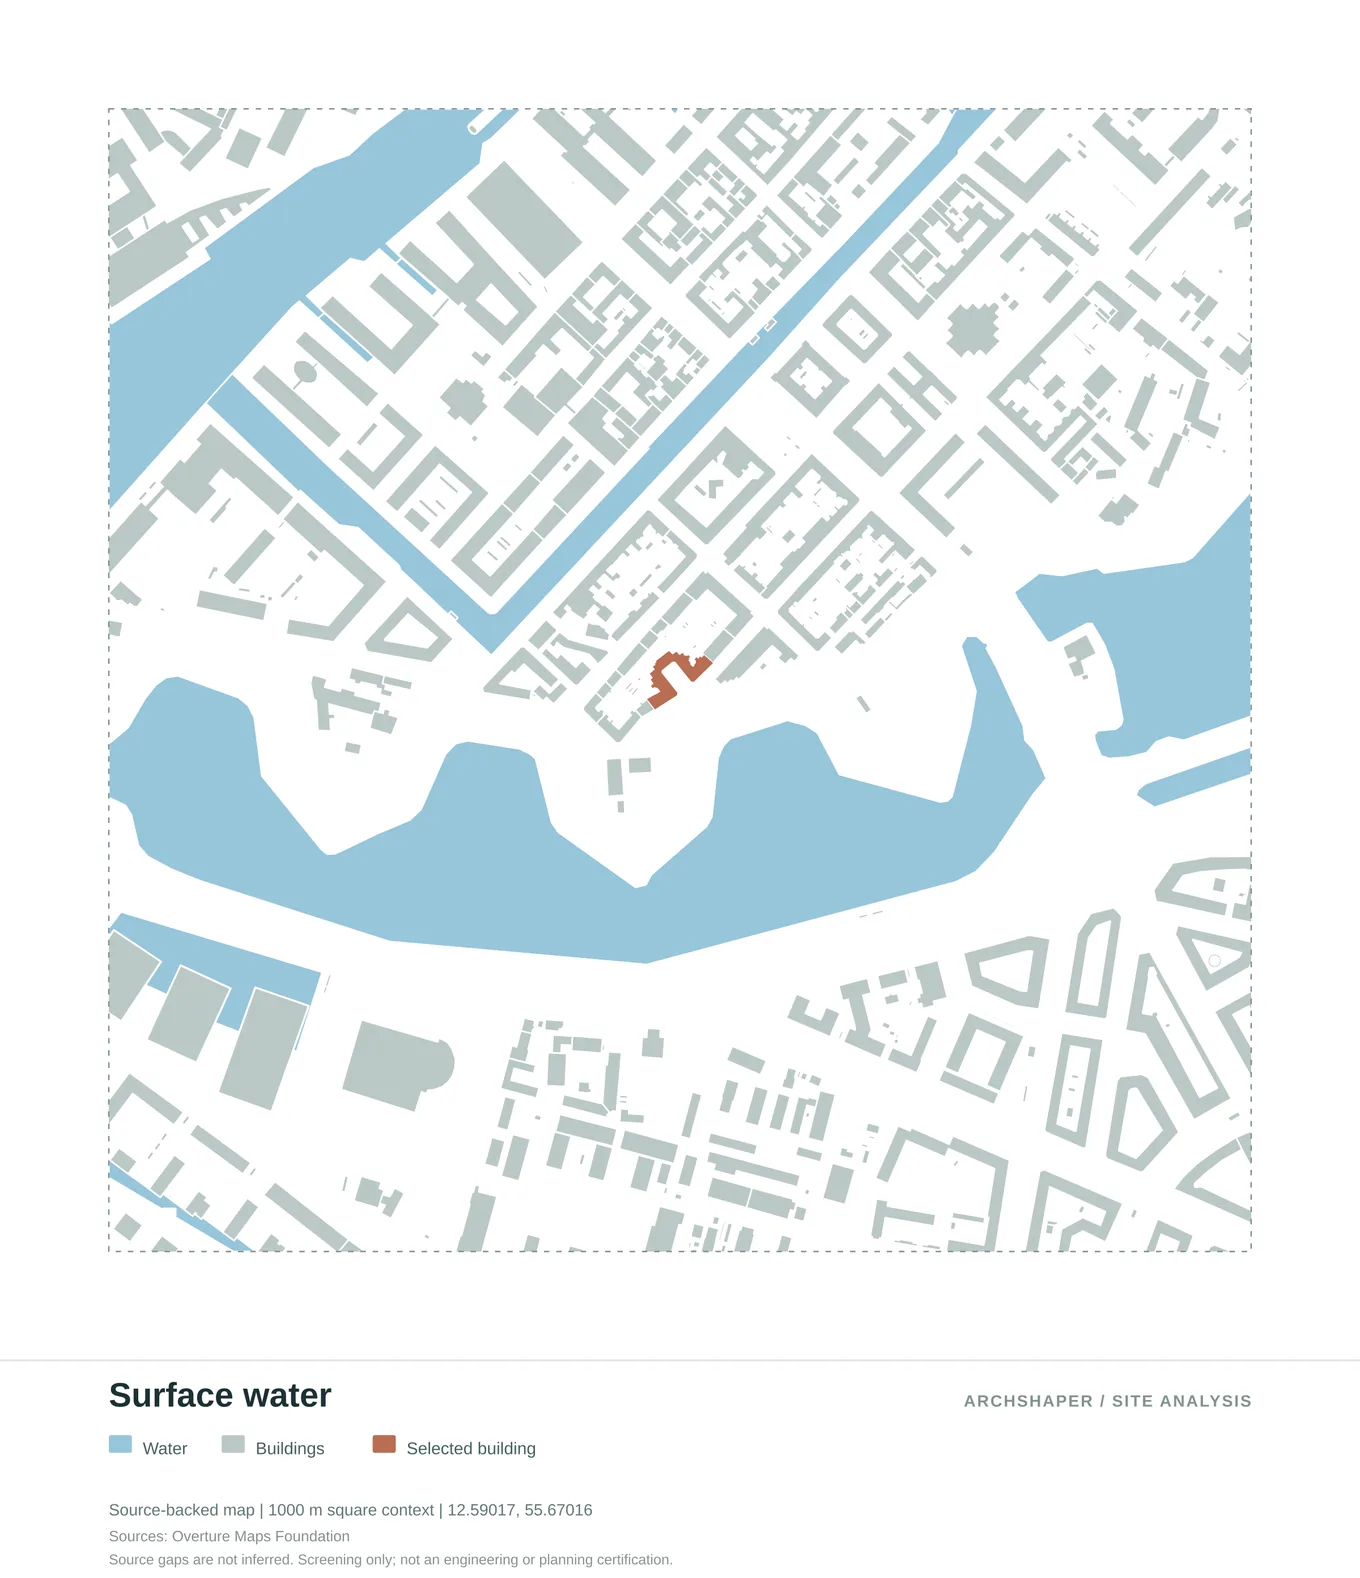
Water bodies and the site's relationship to rivers, canals and coastlines.
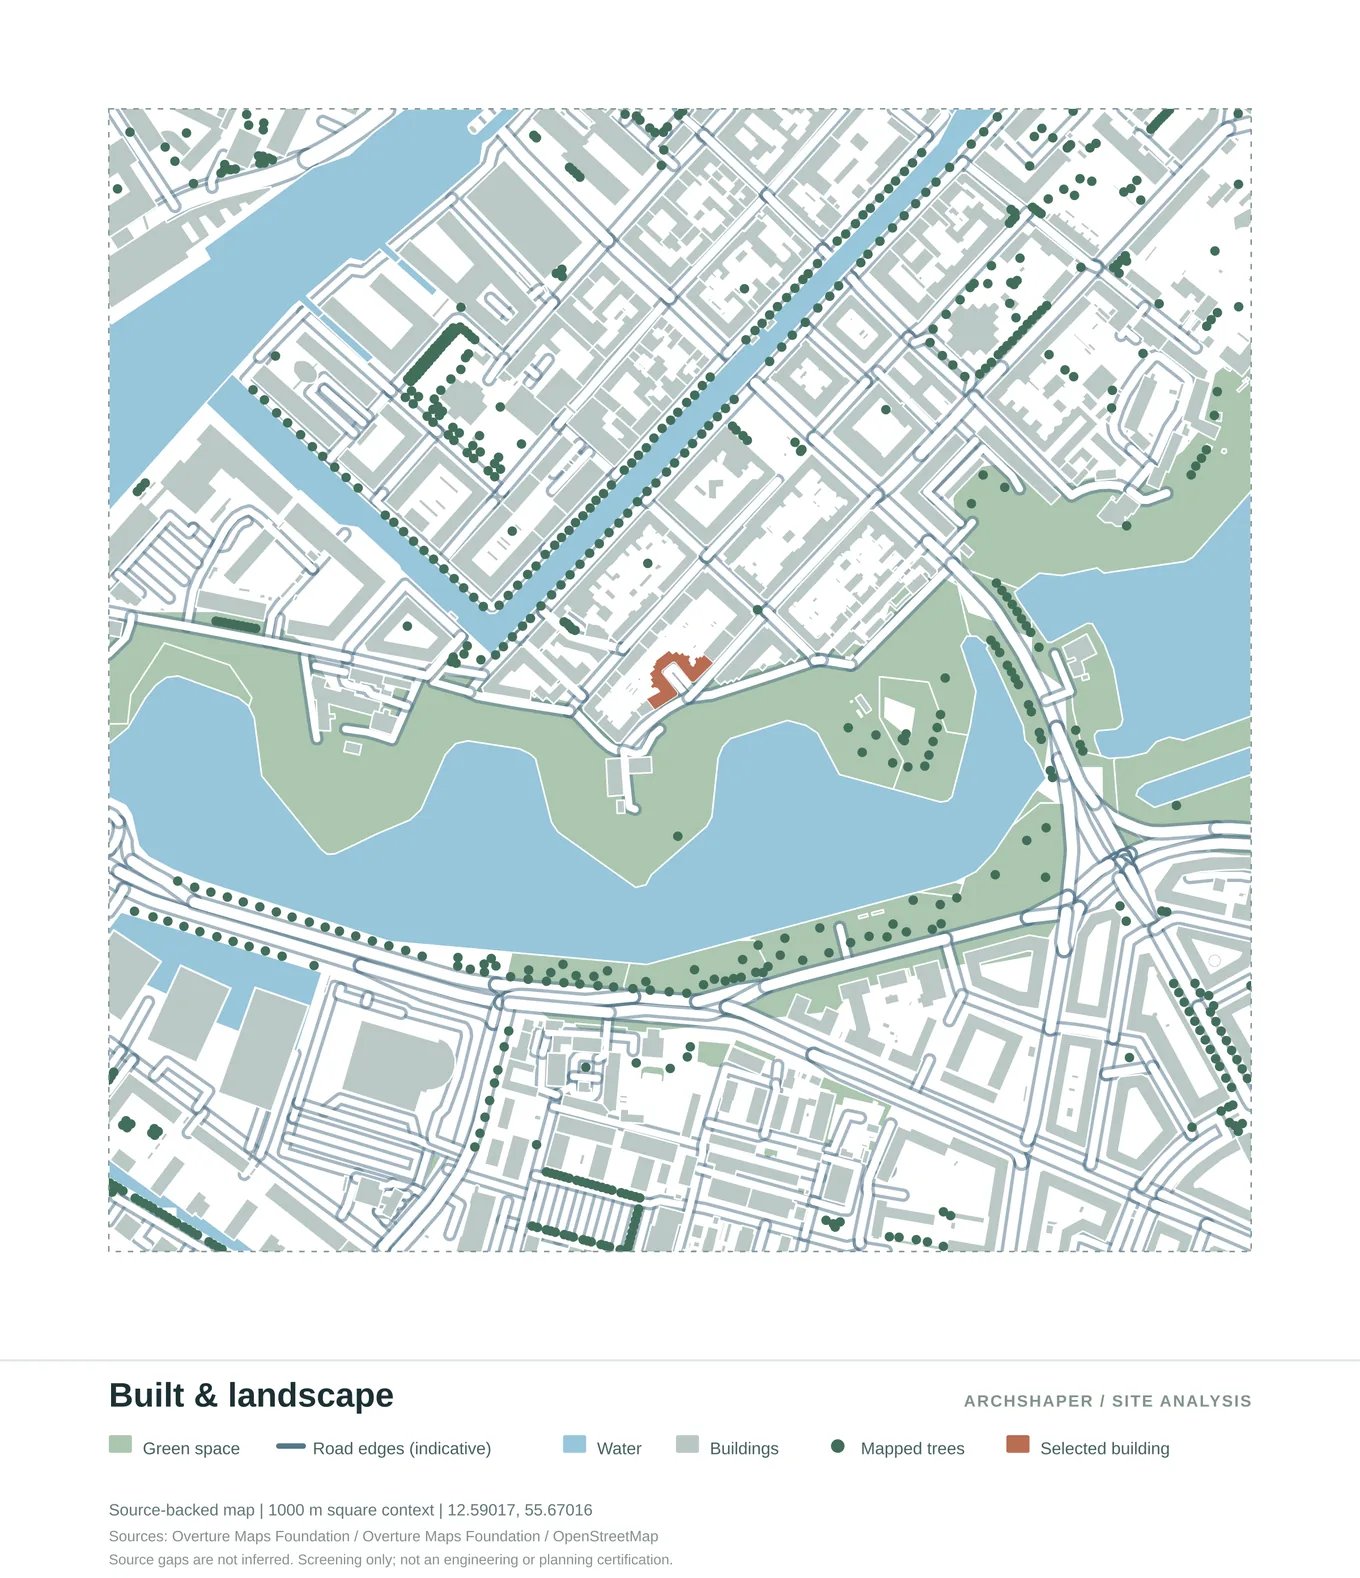
The relationship between urban fabric, vegetation and open space.
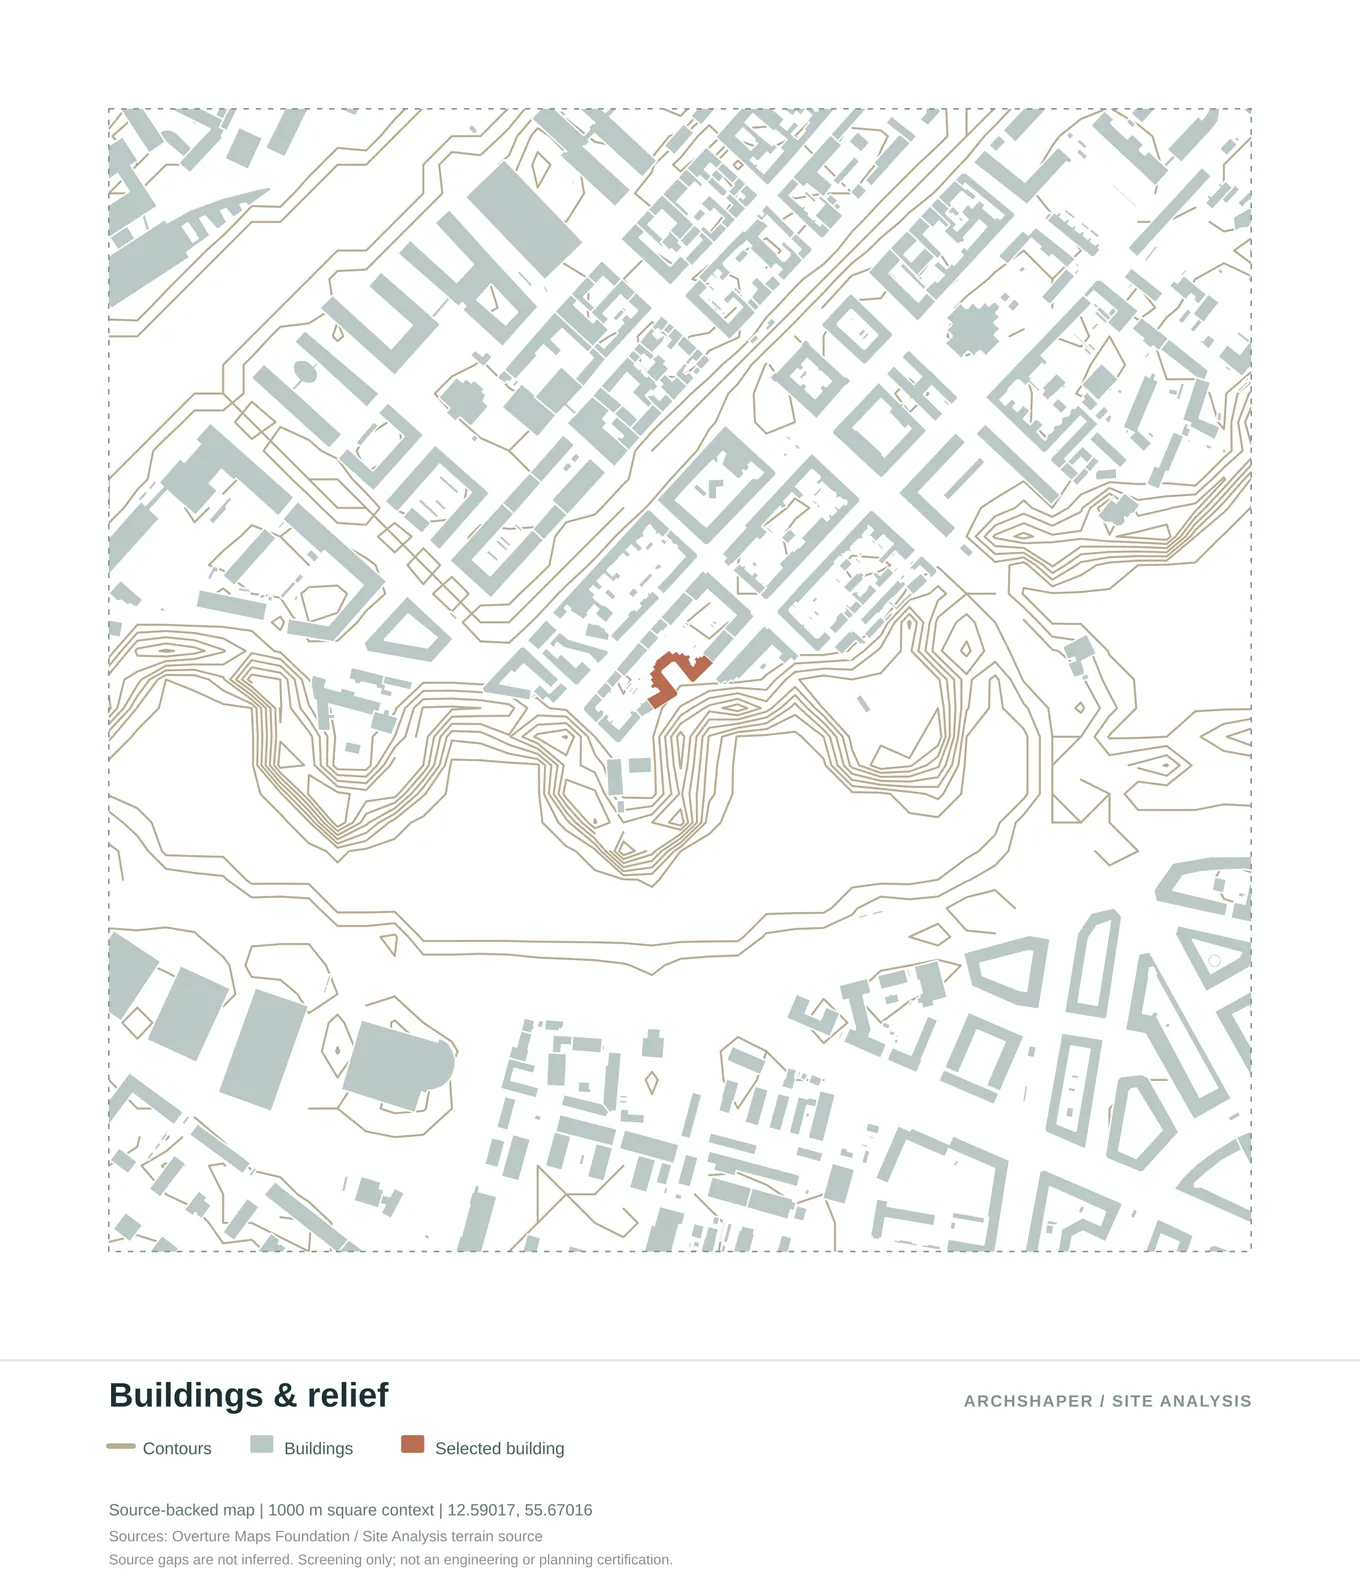
Terrain contours, building footprints and the site context.
What these diagrams can help communicate
Show blue infrastructure and greenery first, then use the terrain/contour view to introduce changes of level. Check authoritative elevation data before designing to precise grades.
Real architectural site analysis examples
Select diagrams that support a project-specific conclusion rather than using every possible layer.
Buildings, streets, landscape, waterways and the selected project site in one map.
A simplified map of built mass and open space around the project site.
Mapped building functions with a clear colour-coded legend.
The relationship between urban fabric, vegetation and open space.
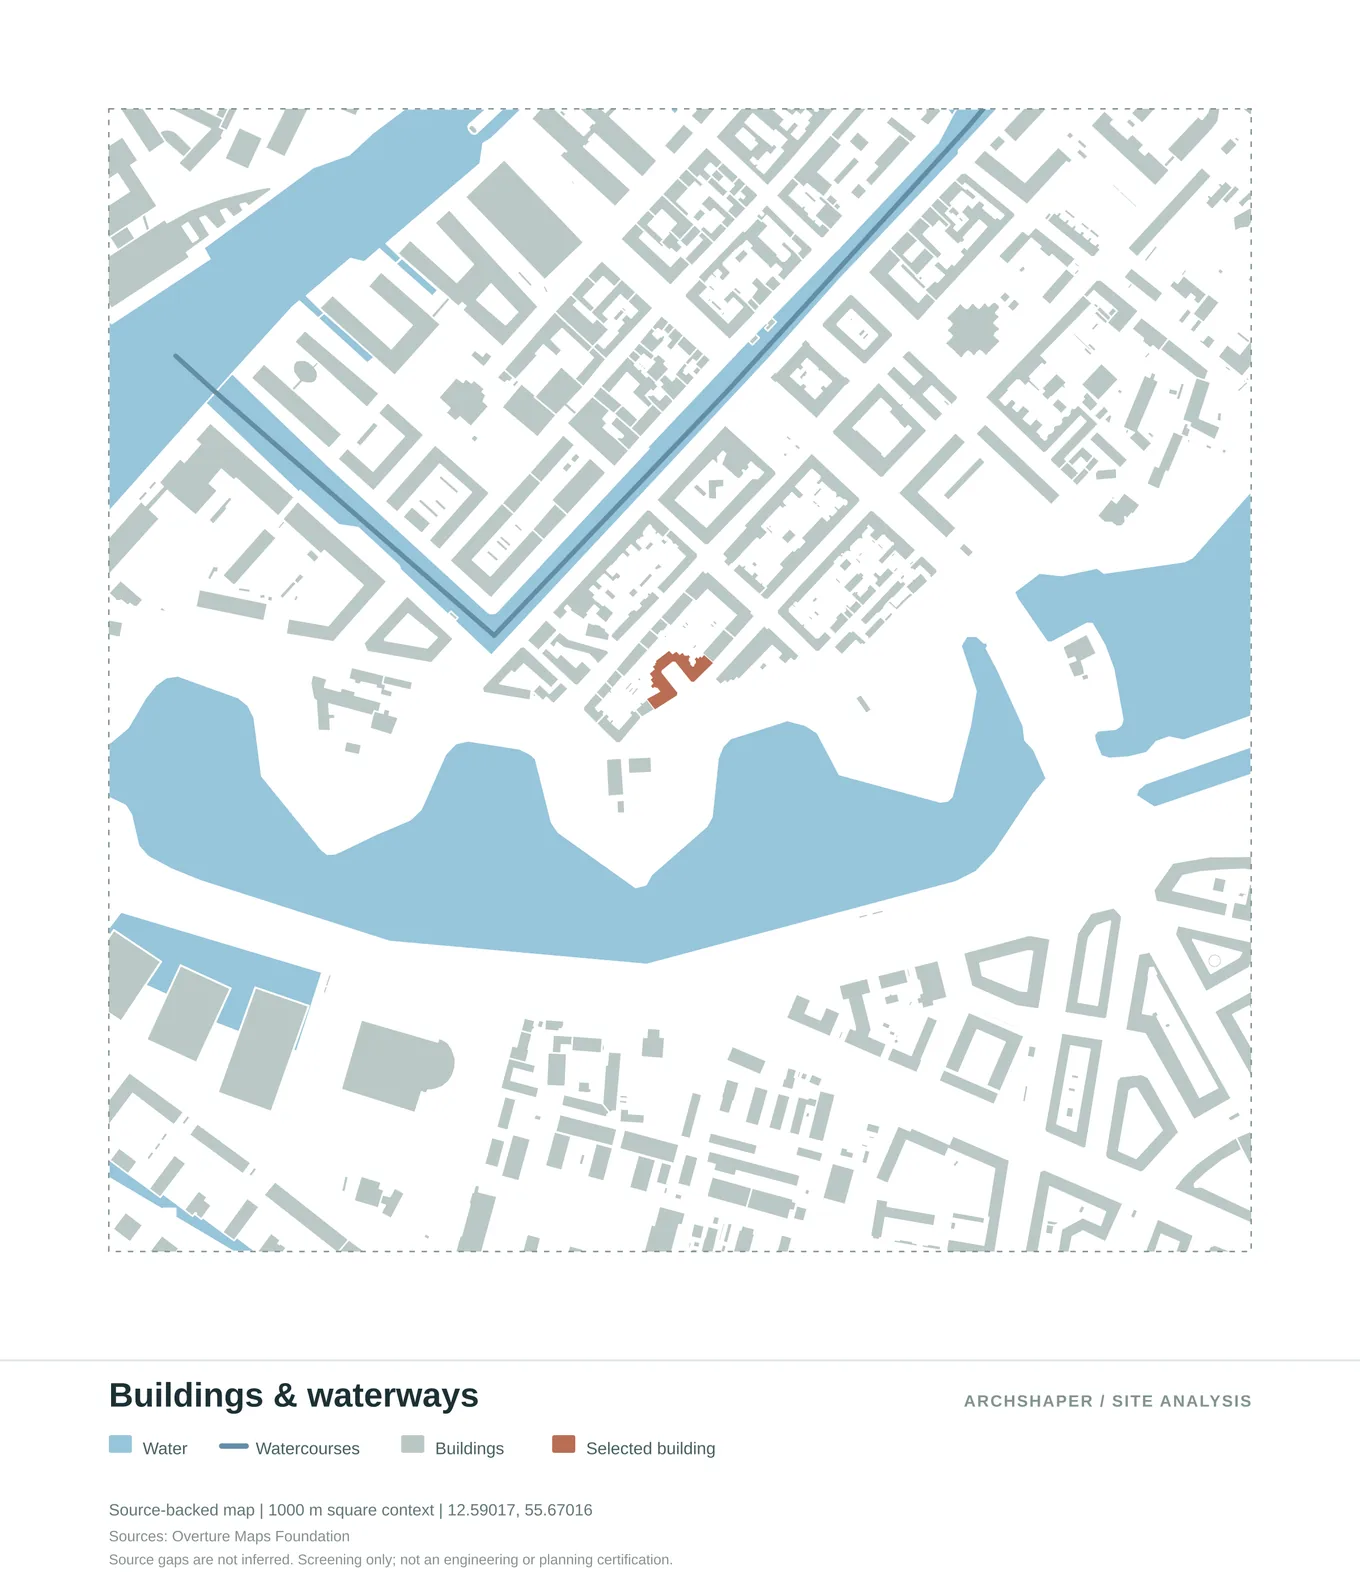
Read the built structure alongside blue infrastructure.
Terrain contours, building footprints and the site context.
Compare mapped zones of lower and higher relative exposure.
A relative visual comparison of exposure across the area.
Illustrative sun-exposure patterns for a summer reference period.
What makes an effective architecture site analysis board?
Choose a question for each image. A diagram is most persuasive when the viewer can understand what it reveals and why that finding matters to the project.
Keep map framing and the selected site legible from one view to the next. Short captions, a restrained palette and a consistent visual hierarchy are more useful than dense paragraphs placed over every map.
Three diagrams can be better than twenty
For an early concept review, a building-context map, an access diagram and one environmental study may be enough. A landscape-led project might need vegetation, waterways and topography instead. The right diagram set changes with the brief.
Archshaper's individual exports let you choose only the relevant views. Keep source information under each diagram and reserve space for design implications on your presentation sheet.
Make the case studies your own
Start with your actual location and decide what the audience needs to understand first. Generate the matching map categories, inspect data coverage and export only the drawings you will use.
The examples on this page illustrate ways to organise real product output. They are not ready-made claims about your proposed site and should not substitute for local planning documents, specialist modelling or a legal survey.
Frequently asked questions
Are the maps on this page real Archshaper examples?
Yes. The images come from genuine Archshaper Site Analysis exports. The suggested presentation groupings illustrate possible workflows.
How many diagrams should an architectural site analysis include?
Enough to explain the design problem clearly. Three to six focused views often communicate more effectively than a crowded board, but the brief determines the number.
Can I generate the same diagram types for my location?
Select a site in Archshaper, review which categories and datasets are available there, and choose the diagrams relevant to your project.
Should site analysis examples use the same map extent?
Usually yes within a comparison group. Consistent framing, clear legends and a visible site boundary make it easier to compare conditions.