Site analysis that informs the design
Architectural site analysis is the process of learning how a place works before proposing a design. It connects the site boundary, its neighbourhood, movement, landscape, climate and constraints to a specific architectural brief. This guide shows what to research, what to draw and how to avoid confusing a beautiful graphic with reliable evidence.
Step 1 of 7
Locate the site and define the study area
The project boundary and map extent determine what the other diagrams mean.
Record the address, surrounding streets, project boundary and a useful context radius. Confirm the location against a reliable source before analysing it.
Output: Site location and context map
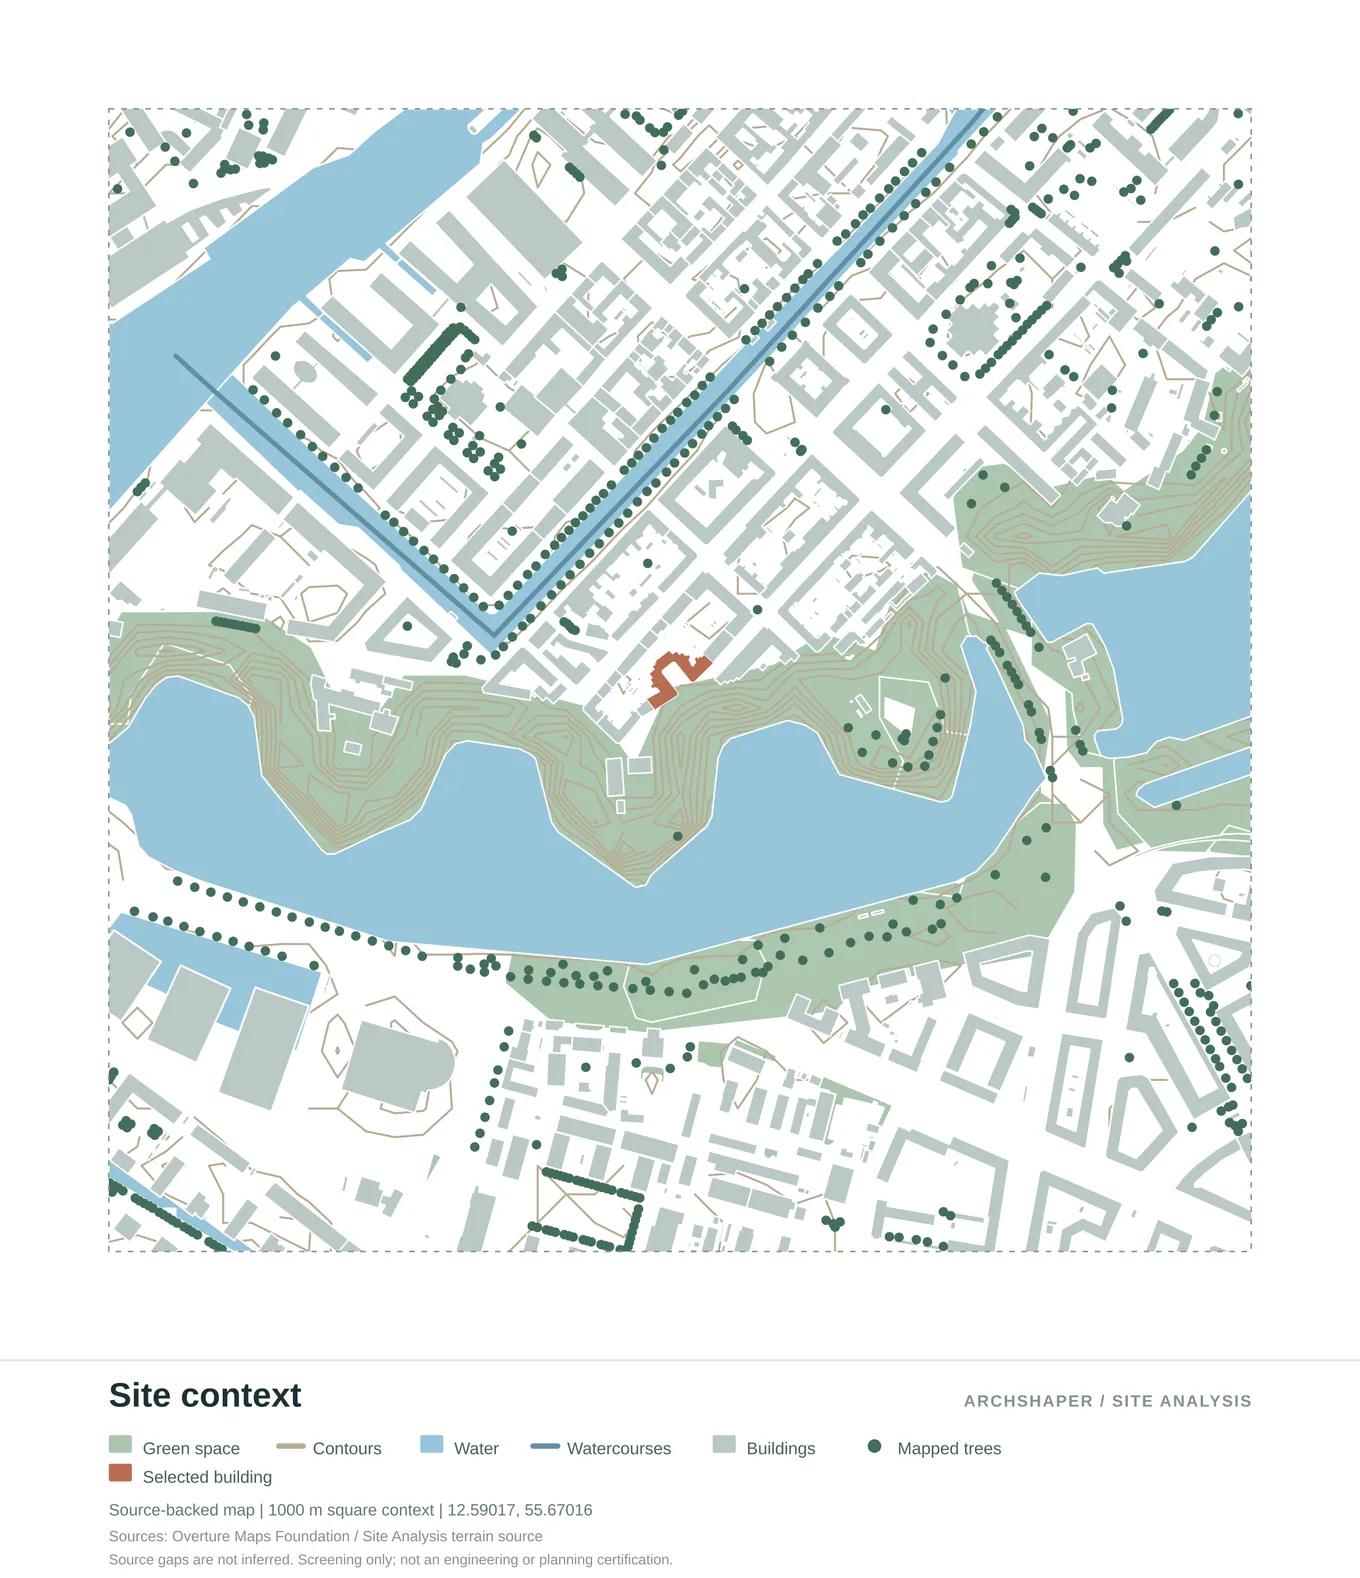
Buildings, streets, landscape, waterways and the selected project site in one map.
Step 2 of 7
Understand built form and land use
Urban grain and nearby uses affect access, privacy, programme and public-space relationships.
Compare building footprints, figure-ground and building-use diagrams. Note where classifications are unknown or incomplete.
Output: Figure-ground and building-use diagrams
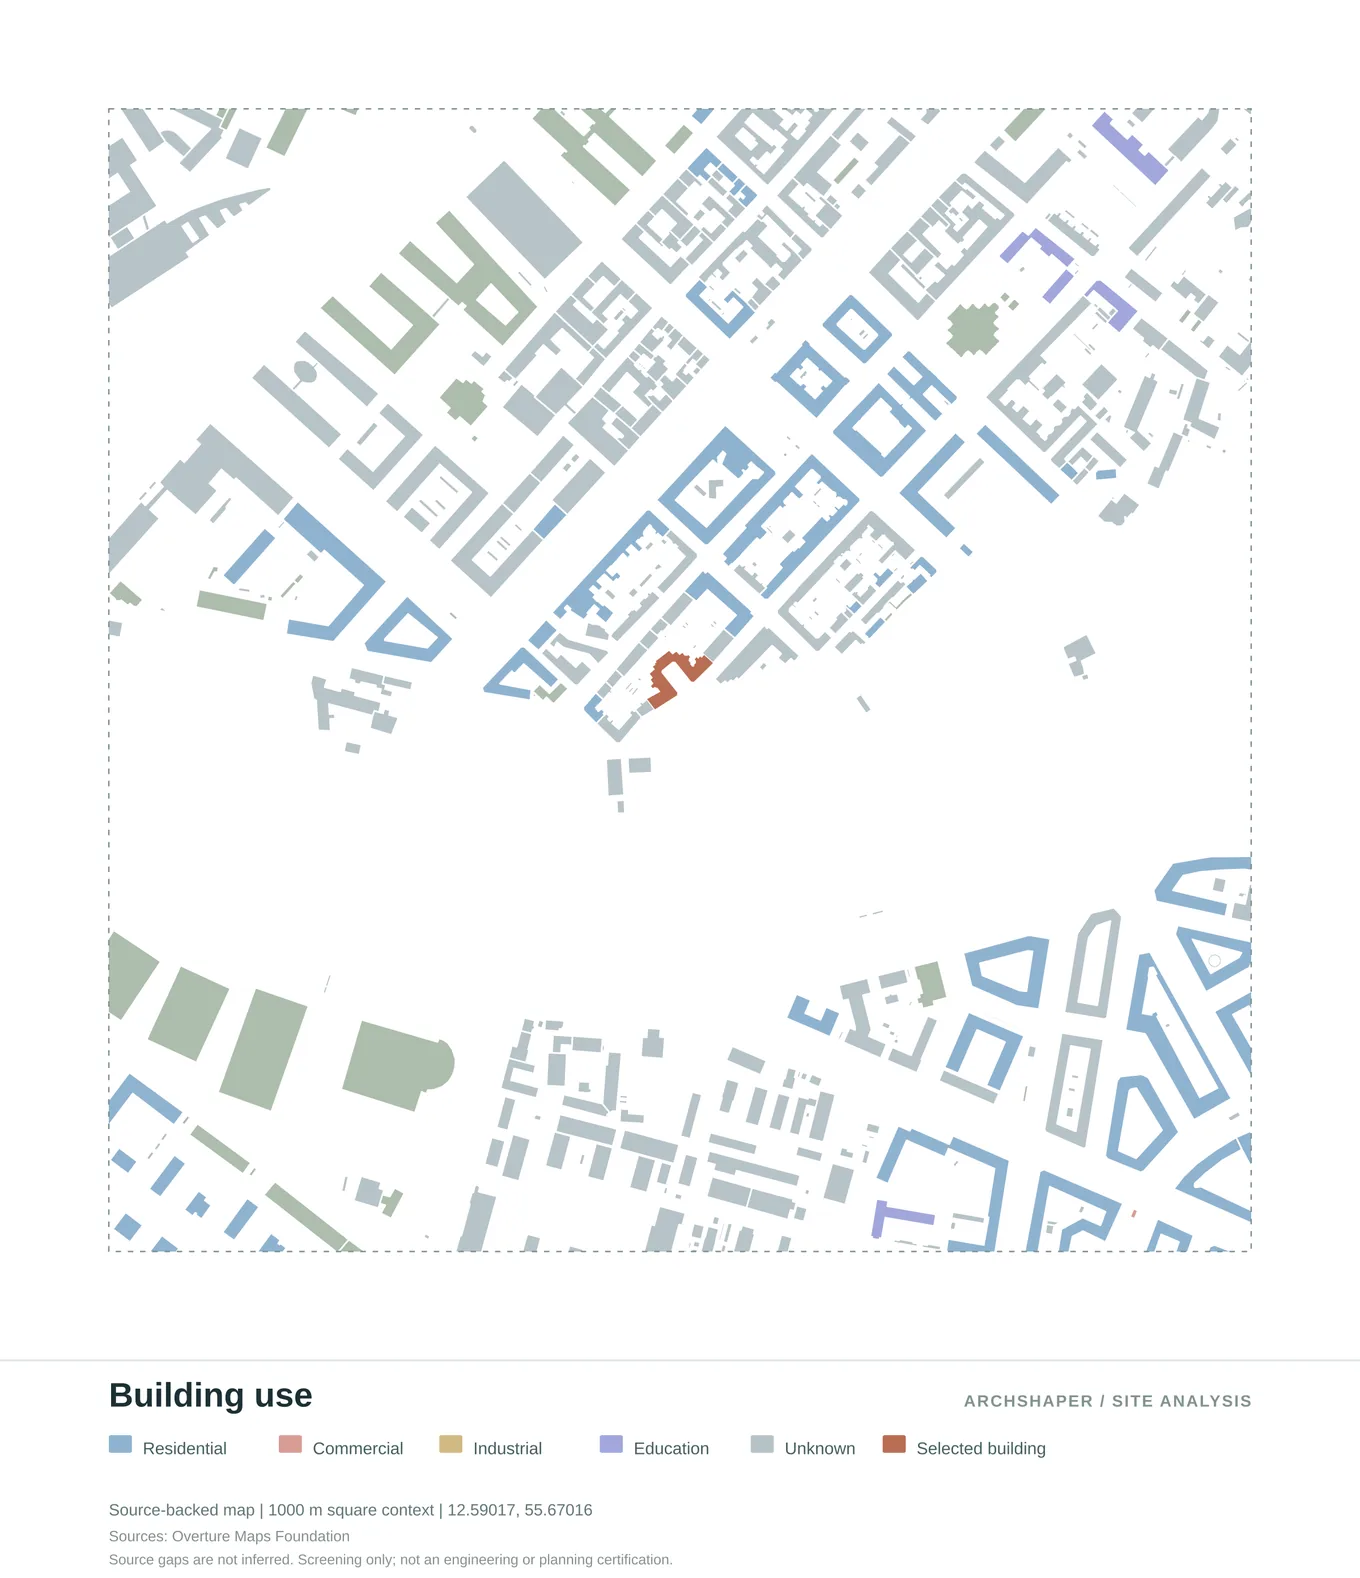
Mapped building functions with a clear colour-coded legend.
Step 3 of 7
Map streets, access and circulation
Approach routes, public transit and street hierarchy shape how people reach the proposal.
Study transport networks and pedestrian routes where mapped. Distinguish actual direction/route data from assumptions about traffic levels.
Output: Mobility and street-network diagram
Buildings, streets, landscape, waterways and the selected project site in one map.
Step 4 of 7
Read landscape, water and terrain
Green infrastructure, waterfront edges and level changes influence site strategy.
Identify vegetation, water bodies and contour information. Confirm elevations with an authoritative DEM or survey for technical use.
Output: Landscape and topographic context
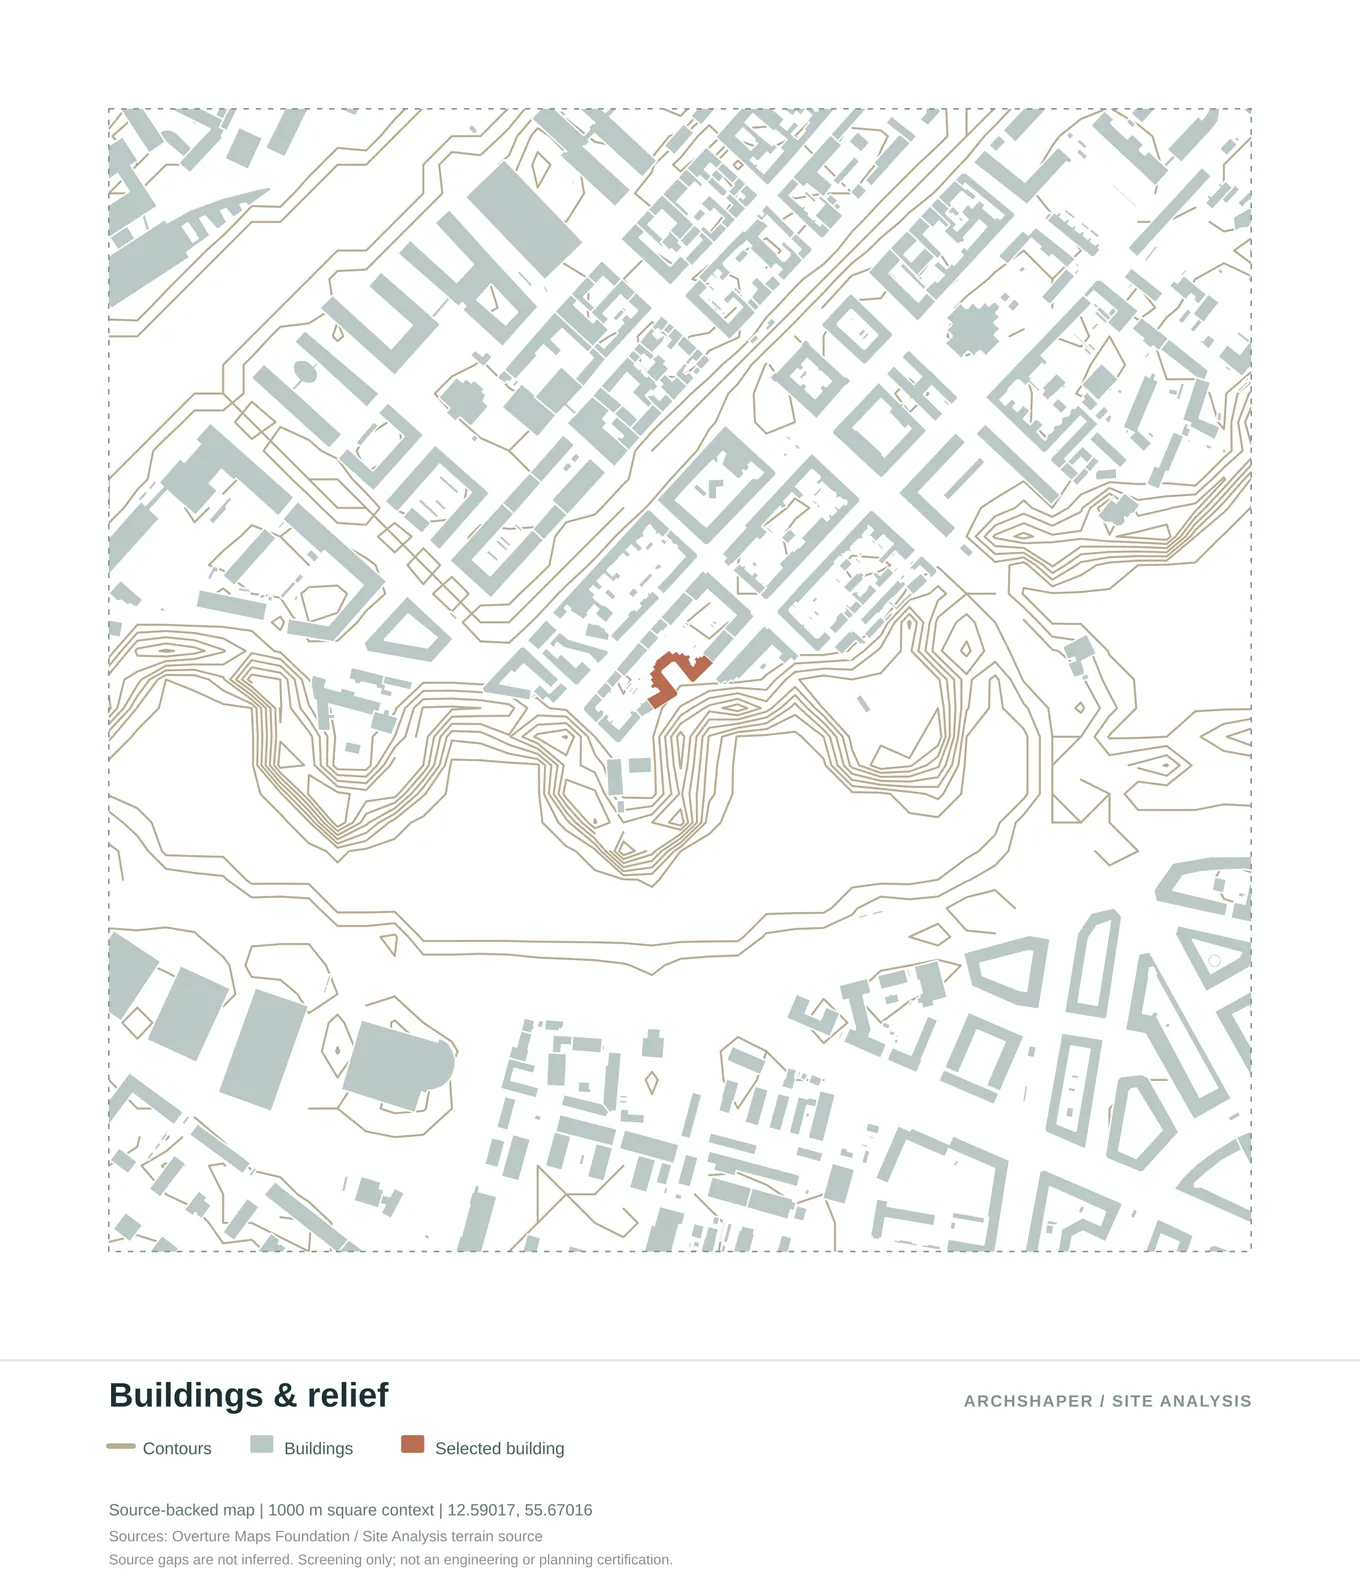
Terrain contours, building footprints and the site context.
Step 5 of 7
Evaluate sunlight and shadow
Selected sun and shadow conditions help frame questions about outdoor space and neighbouring massing.
Compare relevant hours and contrasting seasons. State dates, geometry assumptions and limitations; do not imply a few frames equal annual daylight performance.
Output: Sun exposure and shadow studies
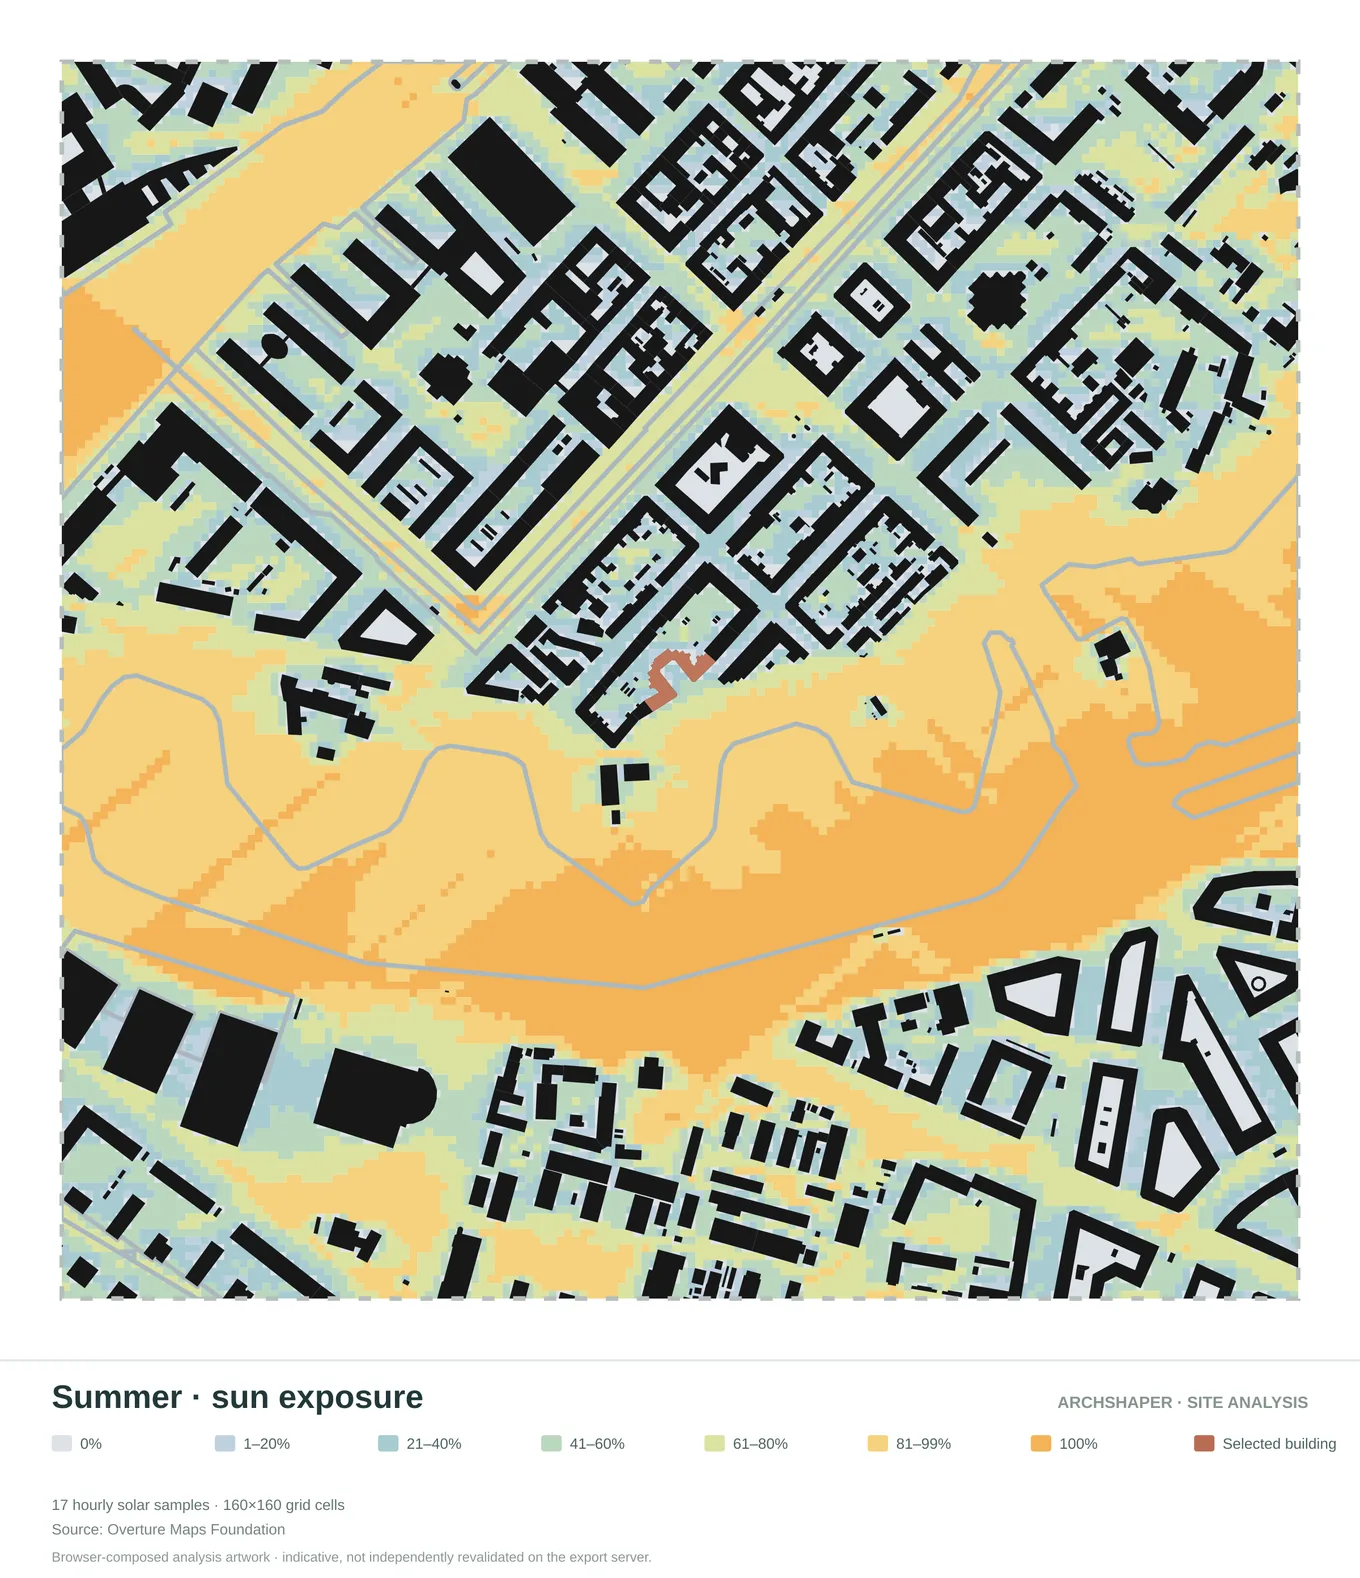
Illustrative sun-exposure patterns for a summer reference period.
Step 6 of 7
Explore wind and noise context
Environmental exposure can inform where later specialist testing is most important.
Review regional wind directions, relative wind exposure and noise-context diagrams. Treat them as preliminary indicators rather than certified local wind speeds or measured dB.
Output: Wind and noise site diagrams
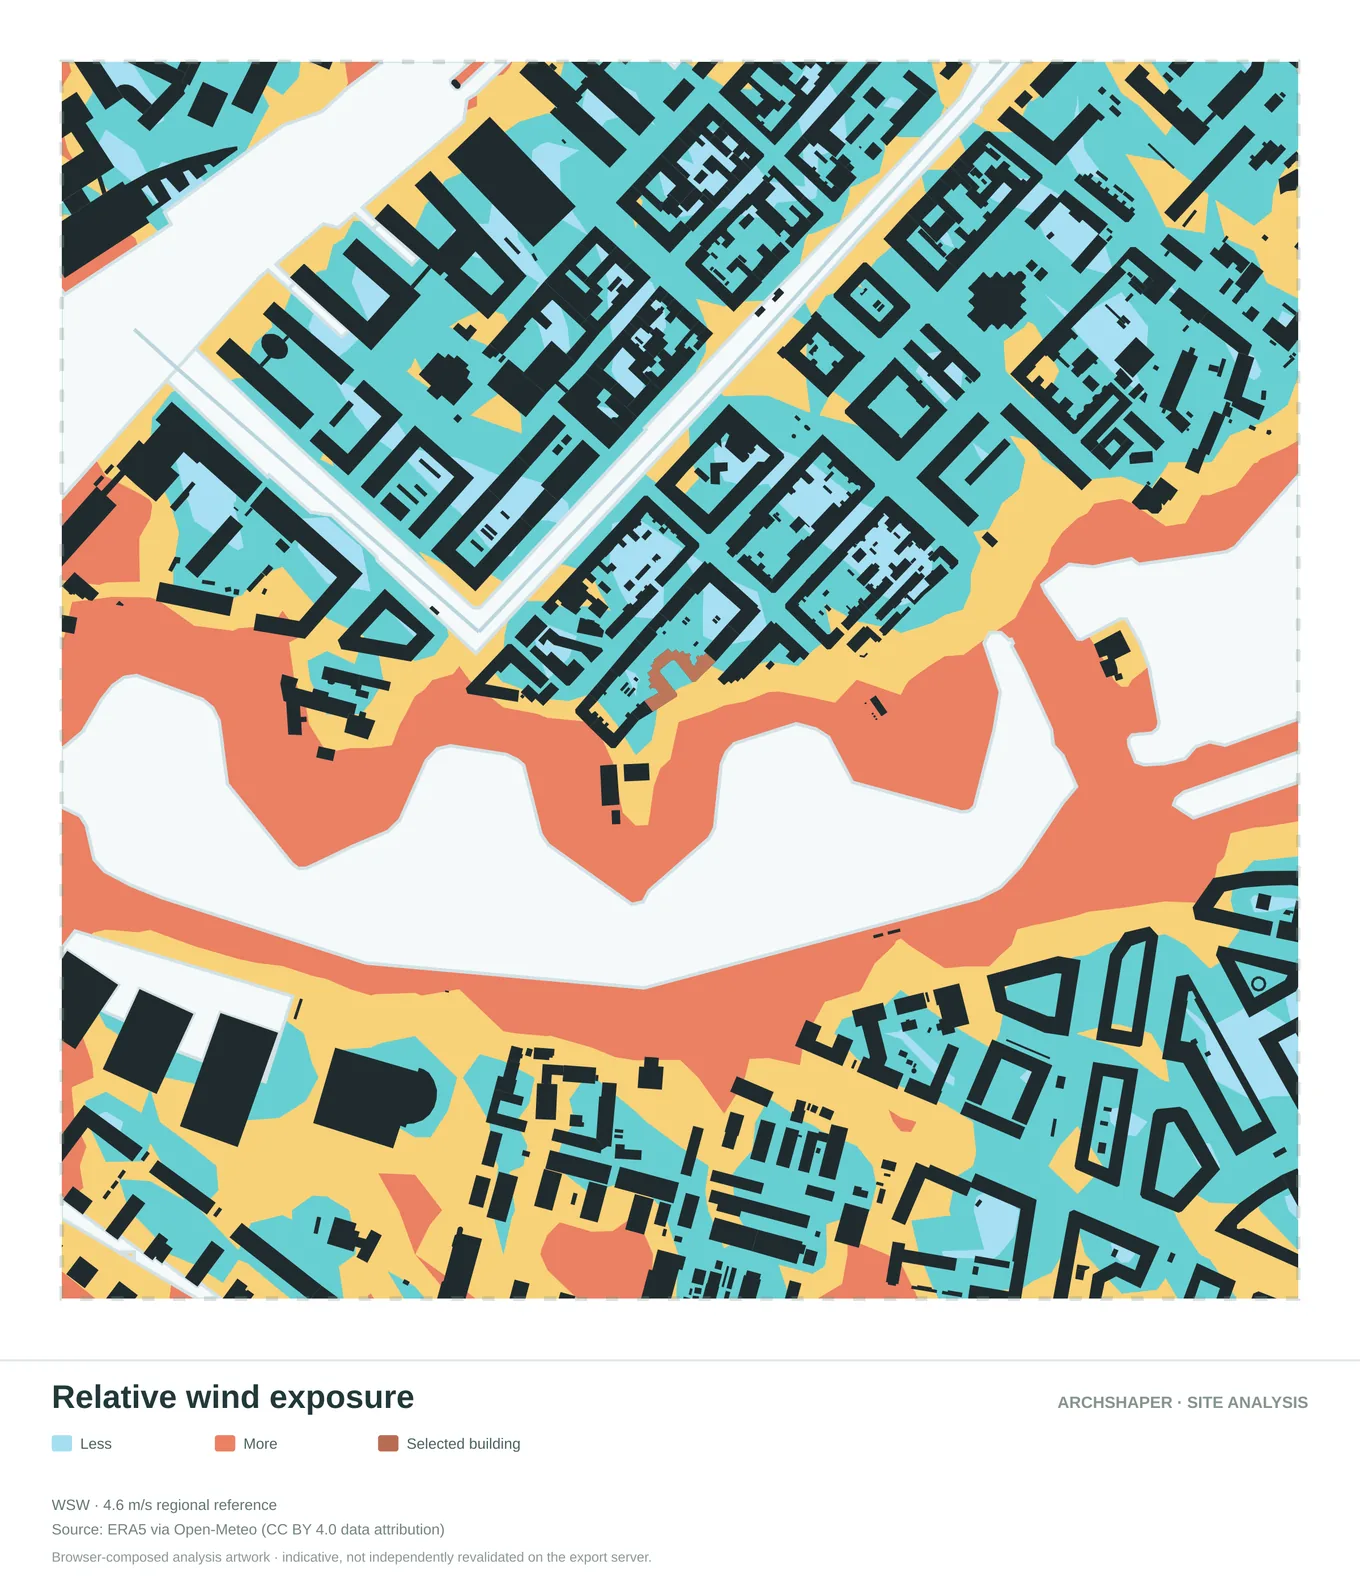
Compare mapped zones of lower and higher relative exposure.
Step 7 of 7
Assemble the analysis into a design argument
A board should lead to insights, not just collect attractive maps.
Select the three to six strongest views, keep their framing consistent, write a one-sentence conclusion for each and verify important source attributions before exporting.
Output: Site-analysis sheet for concept review
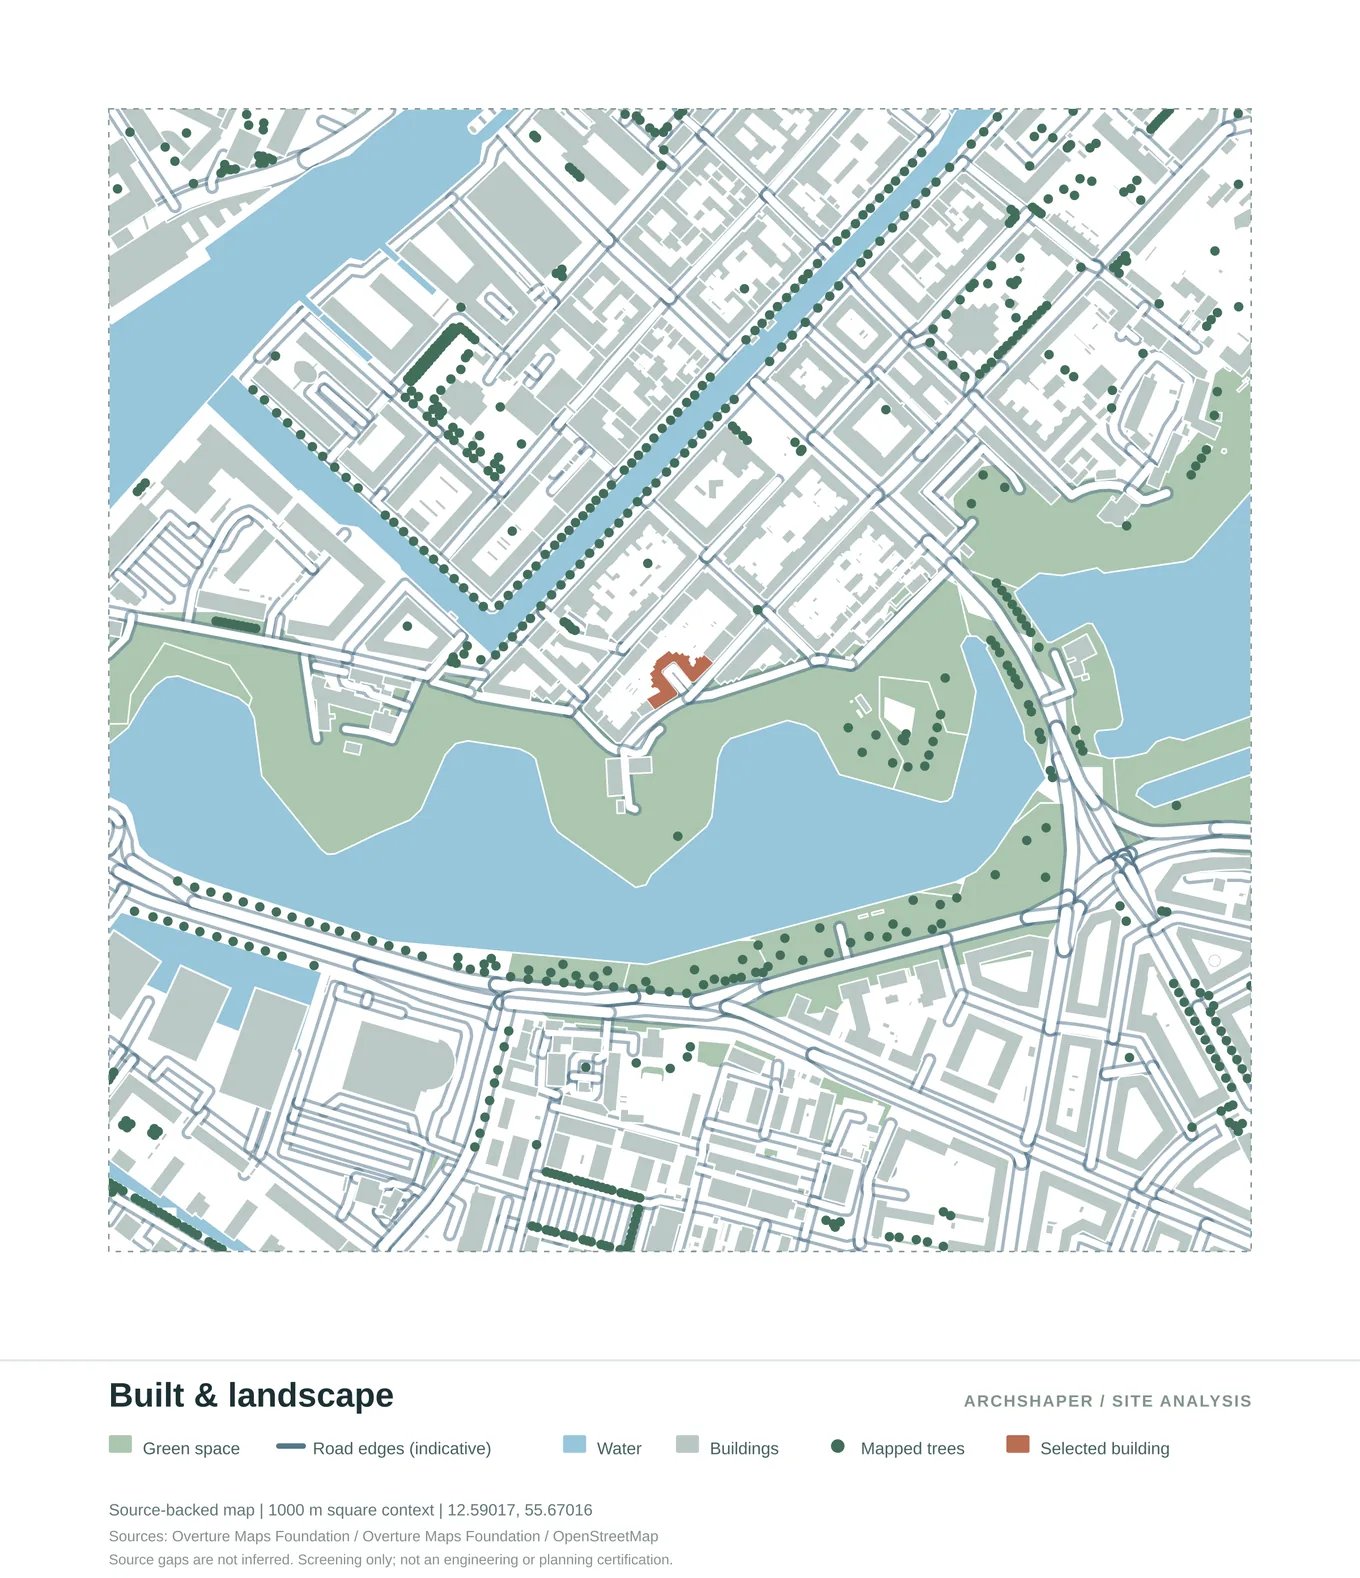
The relationship between urban fabric, vegetation and open space.
Diagram examples for the seven-step workflow
Actual outputs from Archshaper illustrate the kinds of maps that can support each research stage.
Buildings, streets, landscape, waterways and the selected project site in one map.
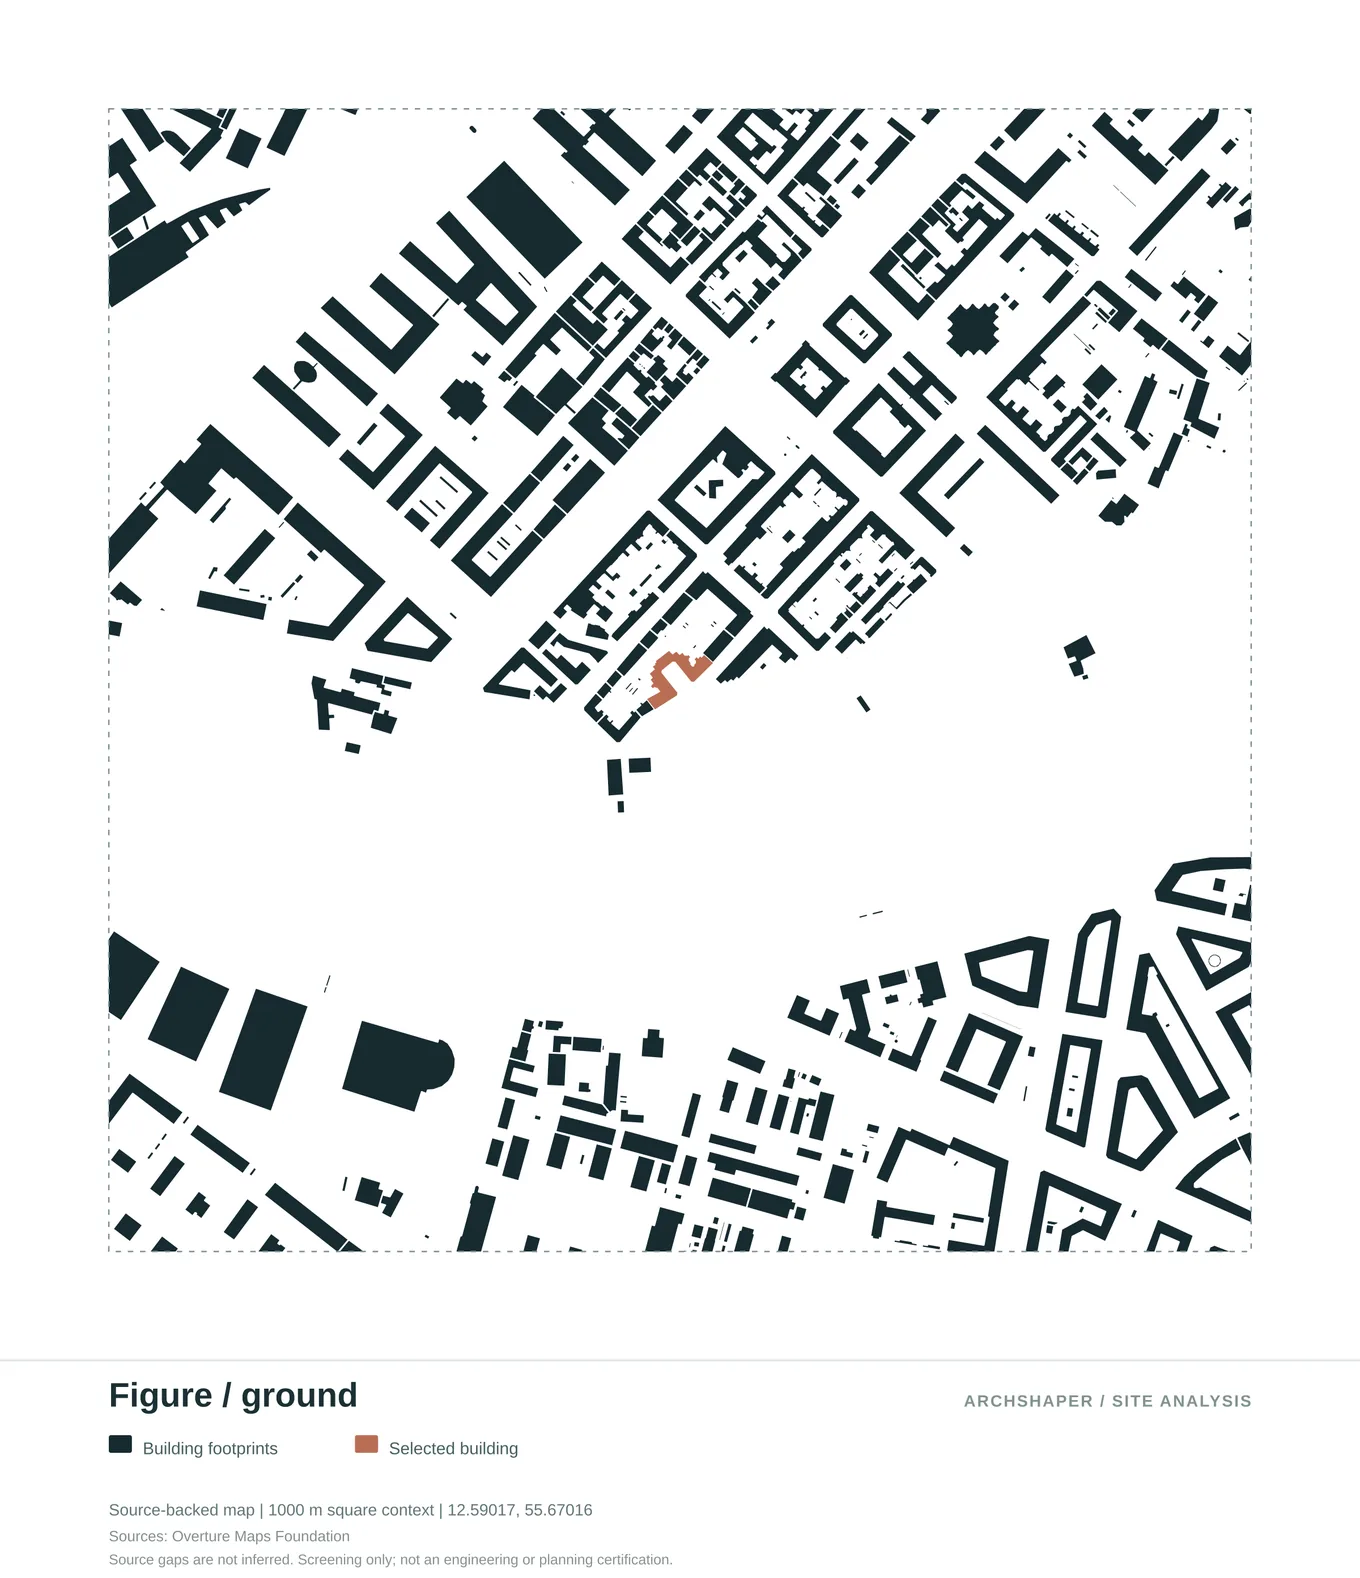
A simplified map of built mass and open space around the project site.
Mapped building functions with a clear colour-coded legend.
The relationship between urban fabric, vegetation and open space.
Terrain contours, building footprints and the site context.
Compare mapped zones of lower and higher relative exposure.
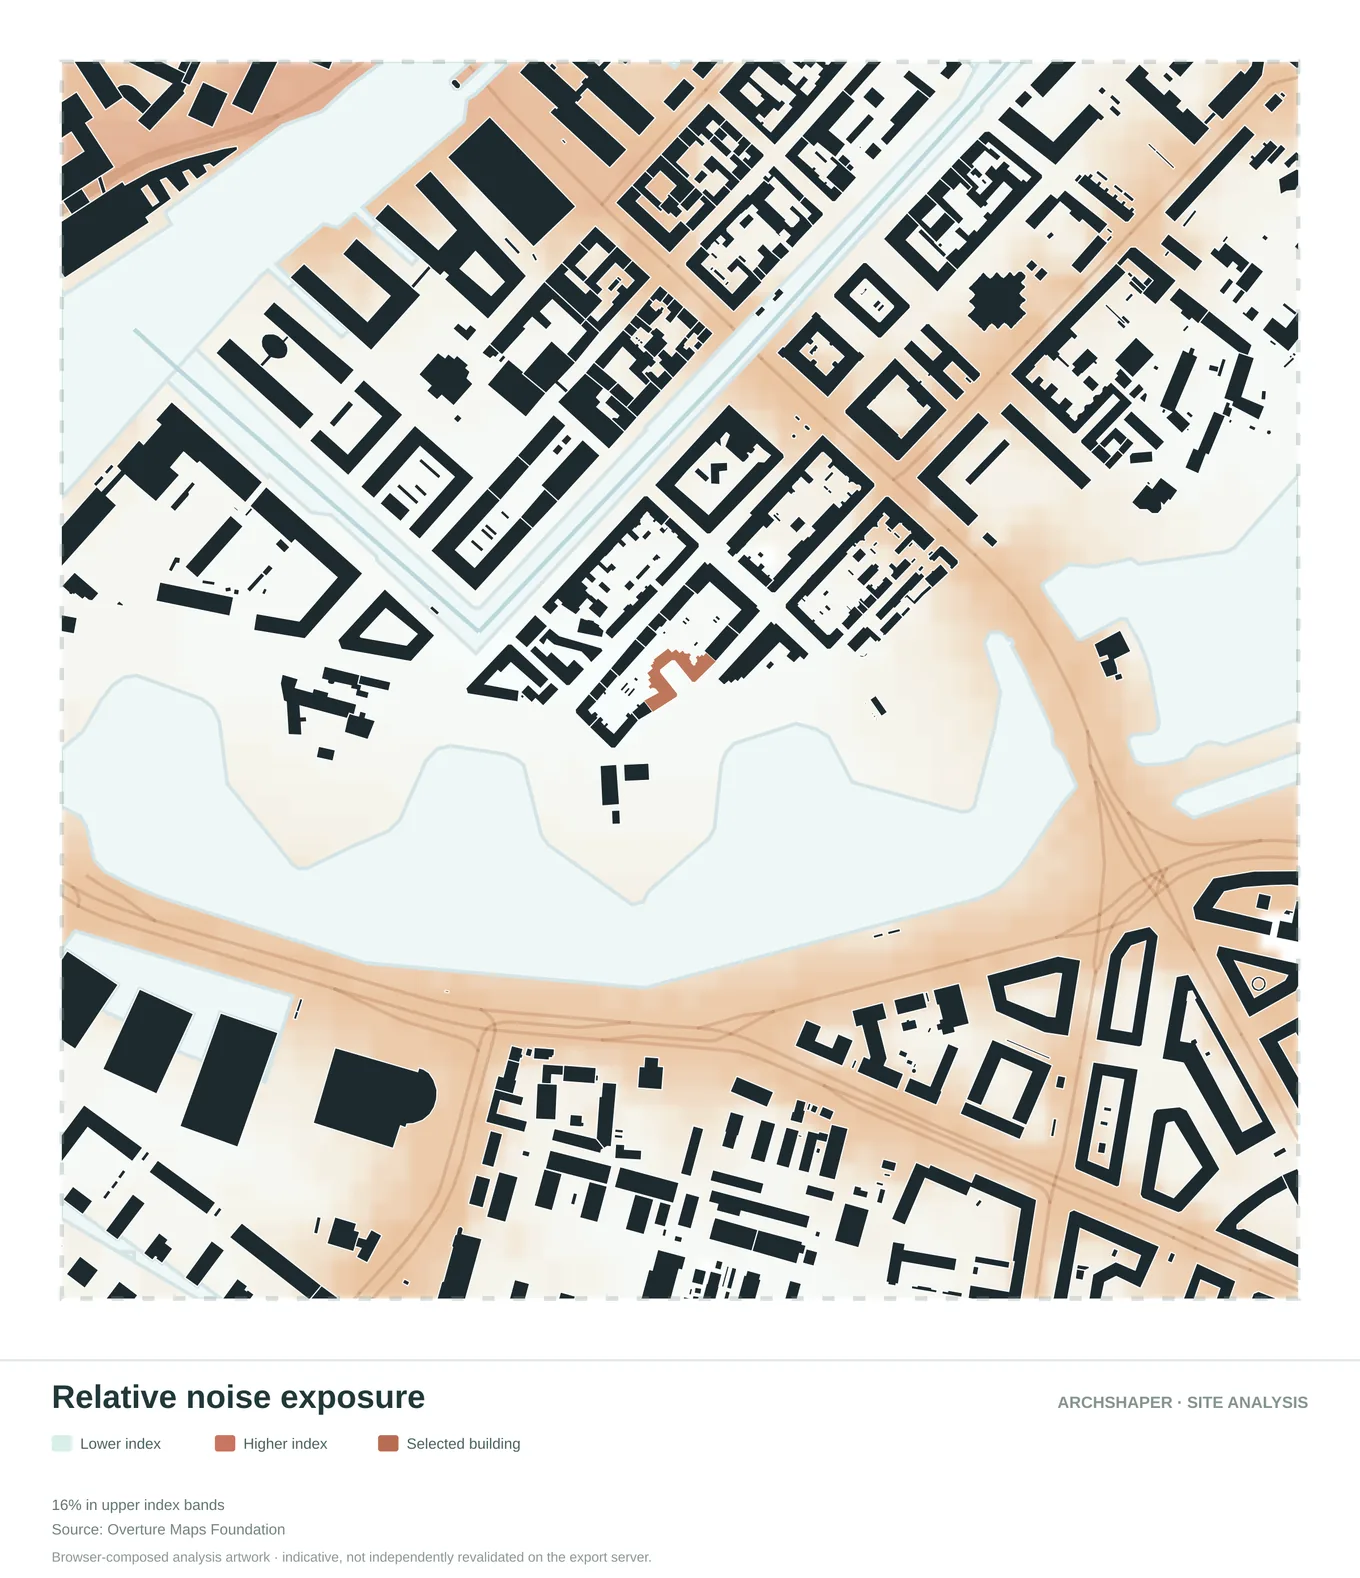
A relative visual comparison of exposure across the area.
Illustrative sun-exposure patterns for a summer reference period.
Which site analysis diagrams do architects need?
There is no universally correct checklist. A compact urban infill study may focus on neighbouring built form, movement, daylight and overlooking. A landscape project may prioritise vegetation, water, relief and local access.
Think in terms of questions: What is already there? How do people move? What environmental conditions matter? Which legal or physical limitations need authoritative verification? Each map should answer at least one.
Primary research and desktop site analysis
A desktop workflow can help you prepare site context quickly, but it cannot replace visiting the site. Record material conditions, actual levels, acoustic character, user behaviour and any temporary factors that mapped datasets may miss.
Combine site photographs, planning information, historic research and discussions with stakeholders when those sources matter to your brief. Label each diagram with its data source and avoid implying a GIS map is a surveyed drawing.
Present findings, not just graphics
Organise the board so the reader understands where the project is, what the main conditions are and how those conditions might influence design decisions. Use concise captions with clear evidence and carefully separated assumptions.
Archshaper can reduce the drafting work behind several diagram types. The architectural judgement—selecting studies, interpreting the data and communicating decisions—remains with the designer.
Frequently asked questions
What is site analysis in architecture?
It is the study of physical, social, environmental and regulatory conditions that can influence a proposed architecture project.
What should I include in a site analysis sheet?
Usually a site-location map, urban context, circulation, built and natural systems, and the most relevant environmental conditions, plus sources and concise design conclusions.
Can I do site analysis online?
You can begin with online location and map datasets and use Archshaper to generate diagrams, but still confirm important planning, survey and performance data.
How do I start a site analysis with no GIS experience?
Choose the project location, review the available categories and begin with a site context map before selecting more specific studies.
Is one sun or wind image enough for technical design?
No. A few graphical studies do not replace time-based daylight calculations, validated CFD or specialist acoustic assessments.