Understand the conditions around your project
Noise conditions affect entrances, outdoor spaces, bedroom orientation and the experience of the public realm. At concept stage, a clear diagram helps you identify where detailed acoustic checks may be needed. Archshaper provides visual noise-context studies around your selected site, designed to be read alongside streets, buildings and landscape.
Three views of the sound environment
Real Site Analysis outputs: potential noise sources, relative exposure and areas worth exploring for quieter uses. Each tells a different part of the story.
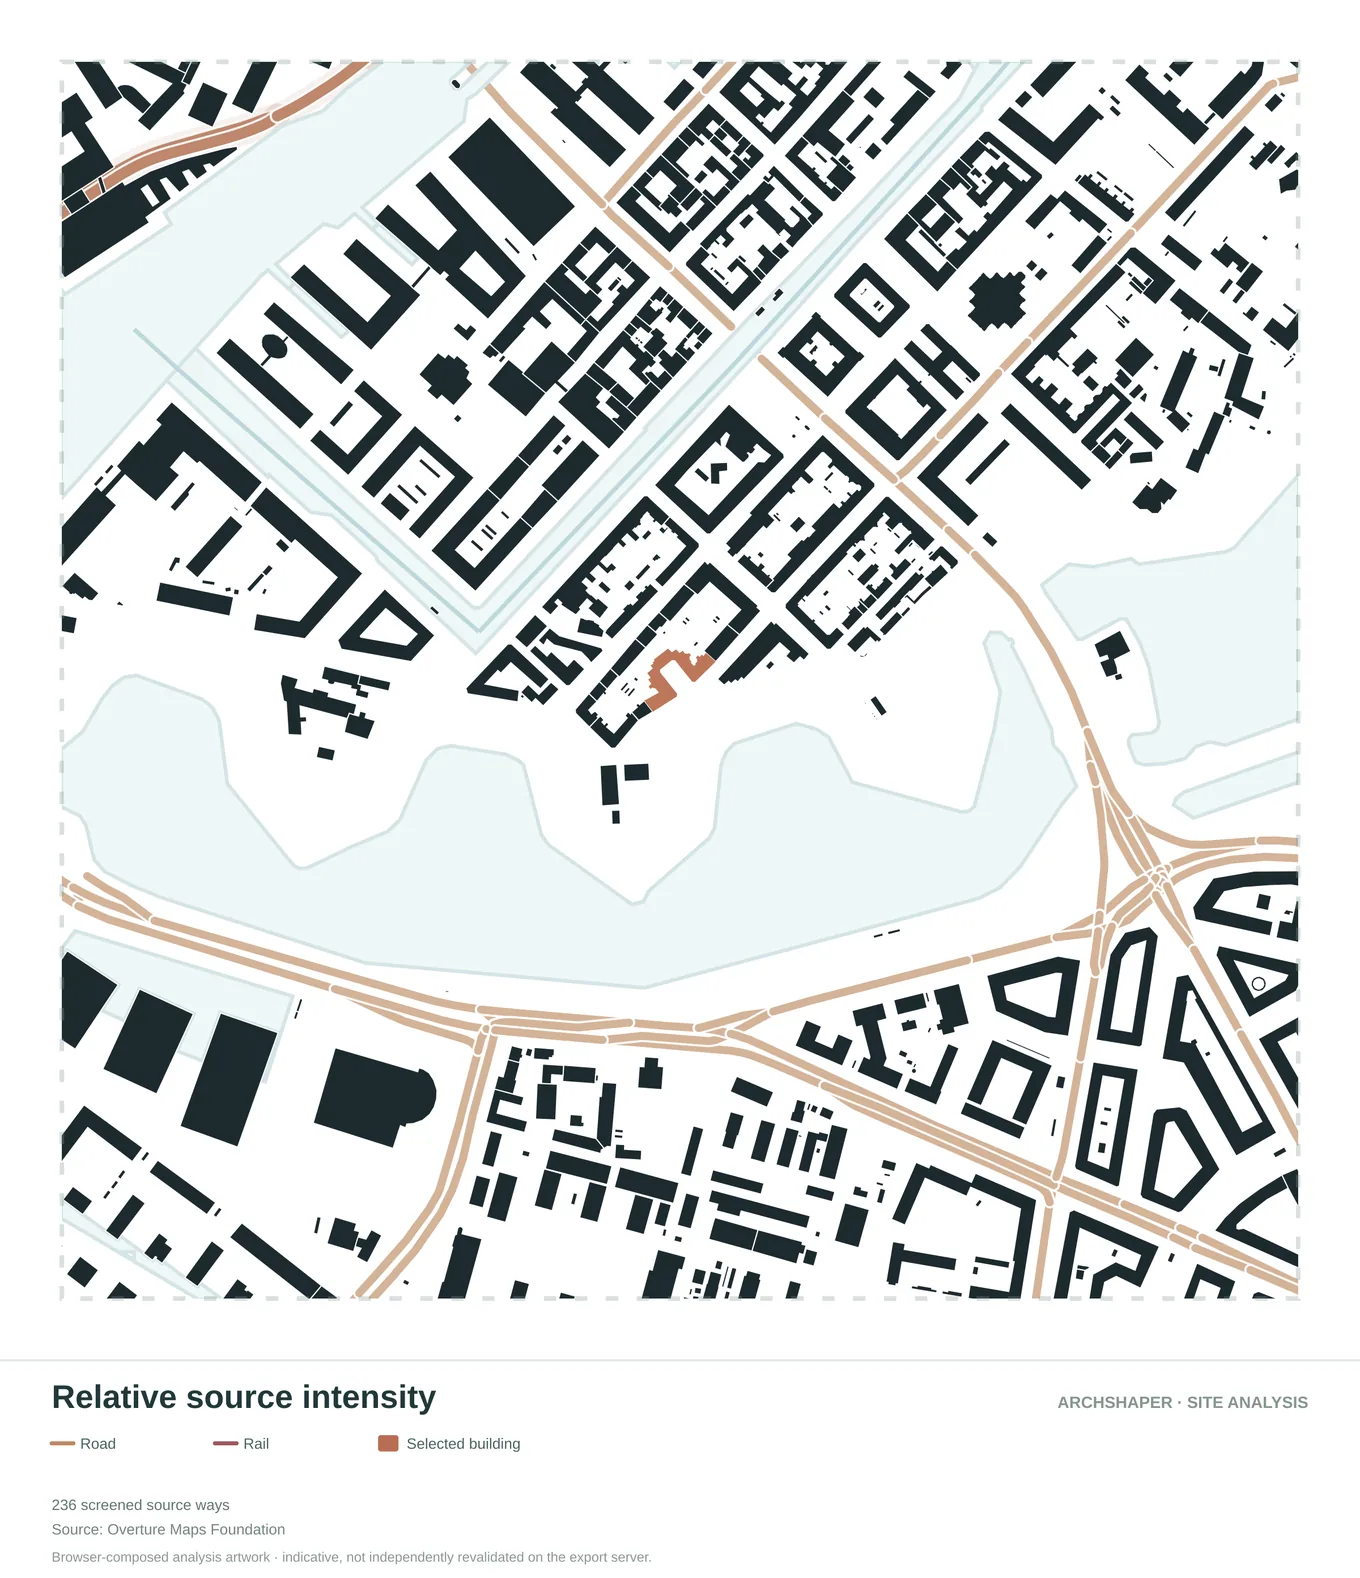
Illustrate potential noise influence around mapped routes and activity corridors.
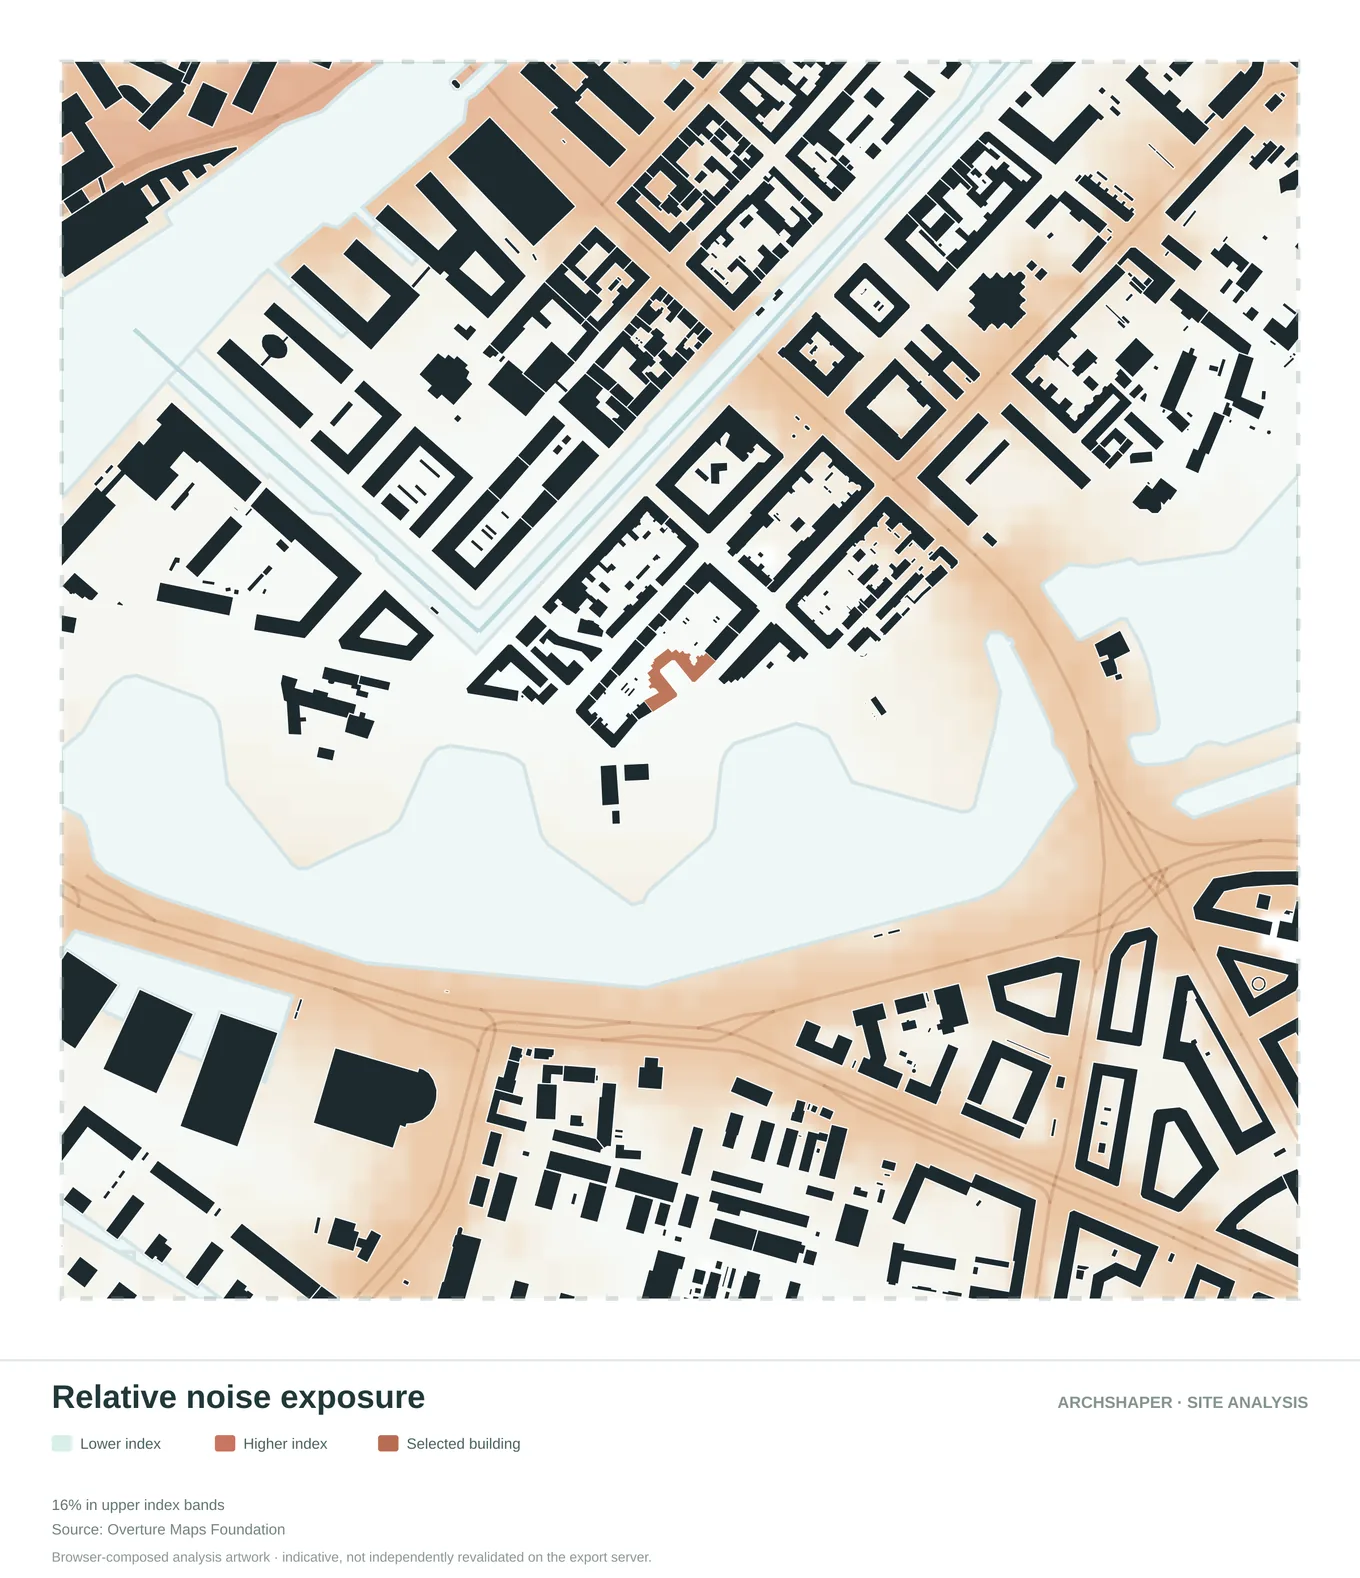
A relative visual comparison of exposure across the area.
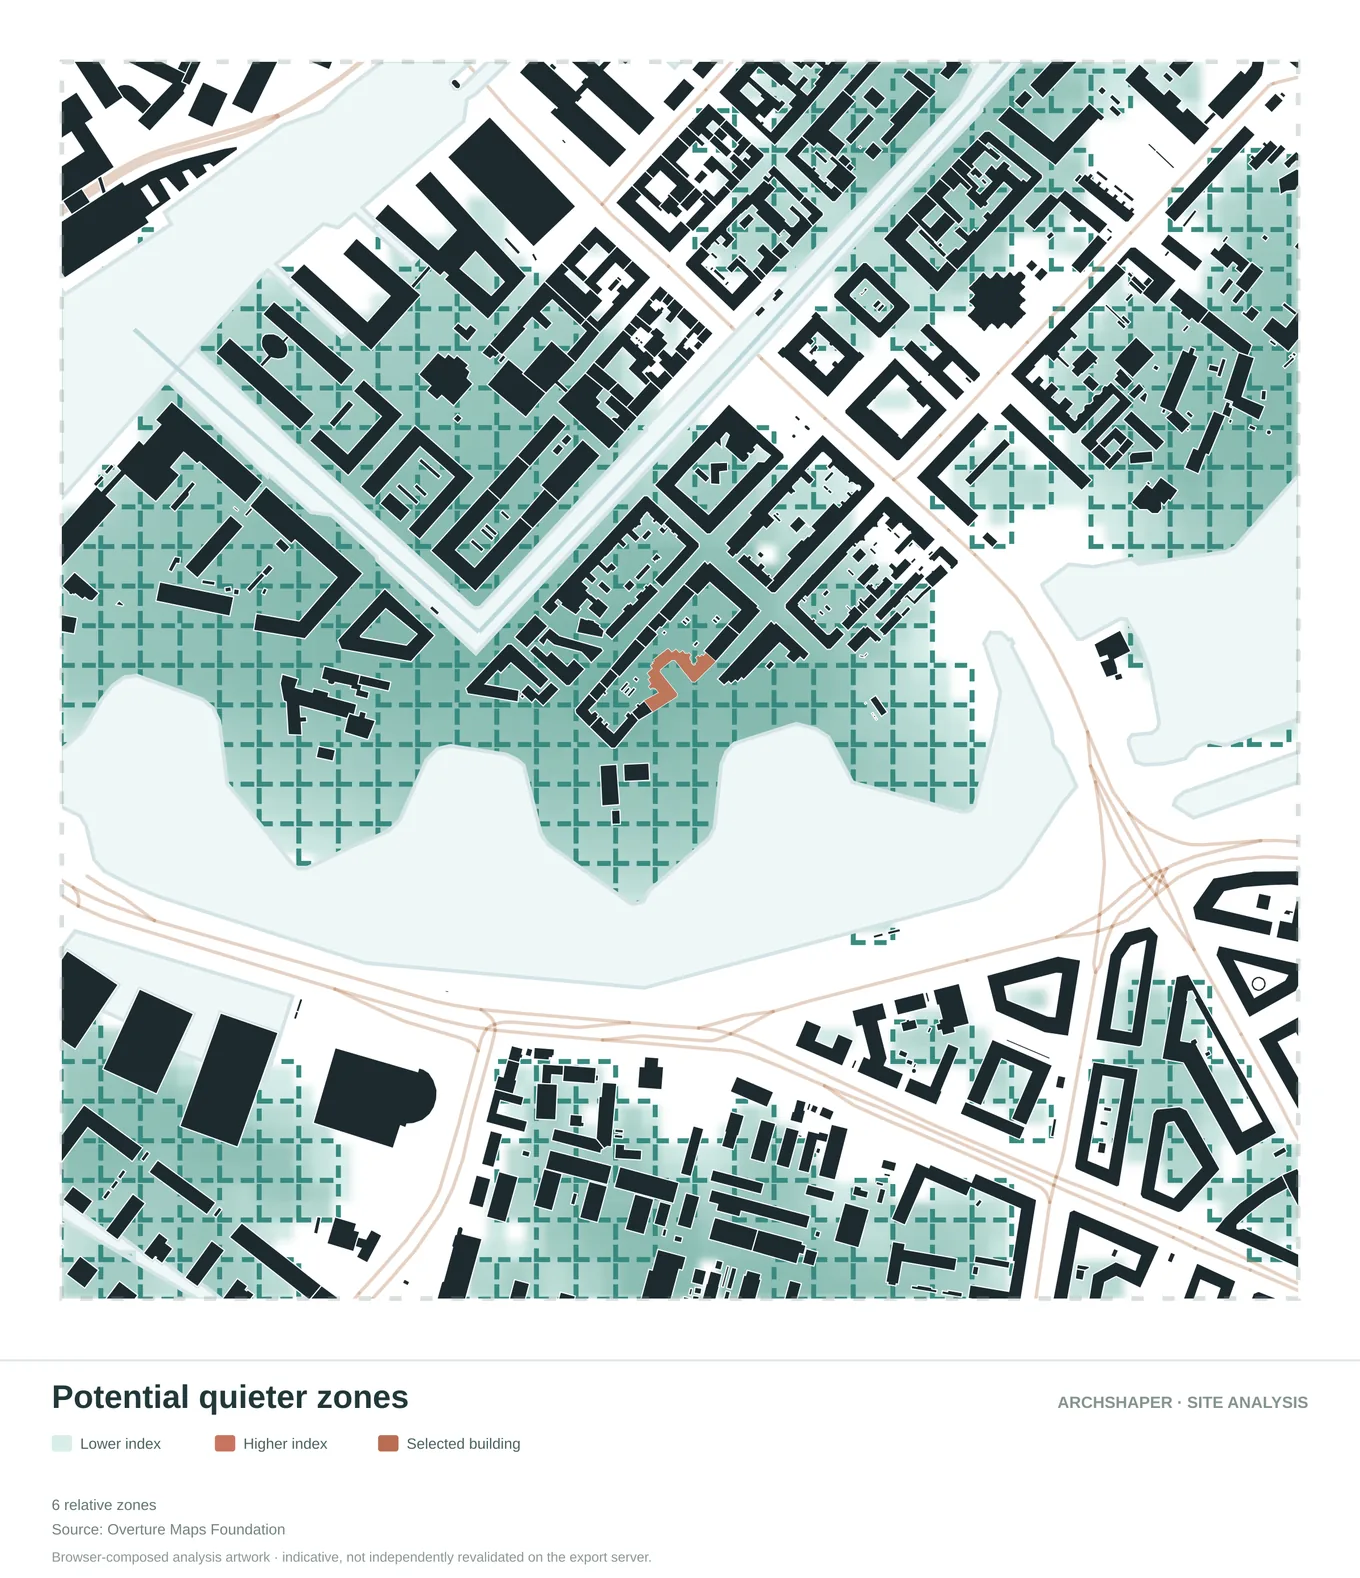
Highlight locations that may warrant closer acoustic investigation.
Read noise sources before judging the site
Begin with where noise could originate. Streets, transport corridors and other mapped sources may influence the surrounding area, especially where a project meets a busy route or open urban edge.
A diagram showing possible sources is a research starting point. It does not tell you how a proposed facade will perform or the exact sound level in a room.
- Locate the main mapped movement corridors.
- Relate them to the selected project's entrances and outdoor spaces.
- Identify questions for a later measured or simulated acoustic study.
Relative exposure is not a measured dB map
Colour classes on an early-stage noise diagram help communicate relative conditions, not certified decibel readings. The relationship between traffic activity, street classification, distance, barriers and local geometry is complex; actual sound levels must be established with suitable measurements or validated acoustic modelling.
Avoid presenting an illustrative heatmap as an official strategic noise map. Include the data-source attribution shown on the diagram and describe the estimation method when sharing it with others.
Use noise diagrams in an architectural presentation
Pair a noise-context map with the transport network and built-form maps. Use matching study extents and highlight the same site so that a viewer understands where sound concerns intersect with circulation and spatial organisation.
The most useful annotation is a testable design hypothesis: for example, whether a street-facing outdoor space warrants an acoustic assessment, or whether a courtyard might require a more detailed review of sound propagation.
When to use a specialist acoustic consultant
Planning conditions, facade specifications, bedroom noise exposure, occupational safety and formal environmental-impact work demand more than a conceptual site diagram. Ask an accredited acoustic specialist for measurements or compliant simulations wherever a numerical threshold or approval is involved.
Frequently asked questions
Can Archshaper measure actual sound levels on my site?
No. These are context and relative-exposure visualisations; they do not replace on-site measurements or validated acoustic predictions.
What do the colours in a noise analysis diagram mean?
They represent classes defined by the particular diagram. Always read its legend and data-source caption before interpreting the colours.
Can I make a noise analysis map for my own project?
Open Site Analysis, choose your location and review the available noise diagrams before deciding whether to export.
Is a relative noise diagram suitable for planning approval?
Not as a stand-alone acoustic assessment. Confirm the authority's requirements and obtain a specialist study when necessary.
What diagrams pair well with noise analysis?
Transport network, built form, water and landscape maps can help explain the physical setting and possible sources.